


Calling tops and bottoms in the crypto space is a futile task, in peak euphoria many are too bullish and think price will forever go up and in the reverse scenario when price is falling many call the death of Bitcoin and crypto.
It is hard to remain balanced but an indicator that can help emotions like the Mayer Multiple can ease the stress somewhat. Created by noted investor and podcast host Trace Mayer, it is defined as Bitcoin's price in relation to the 200-day moving average.
The Mayer Multiple (blue indicator below) can be found on TradingView and can be added to your Bitcoin chart. There are a few levels that are of particular interest and can signify whether it is a good time to accumulate Bitcoin or not. Generally speaking when the Mayer Multiple is above 2.4 this signifies that Bitcoin is entering bubble territory and its probably a good time to reduce your exposure.
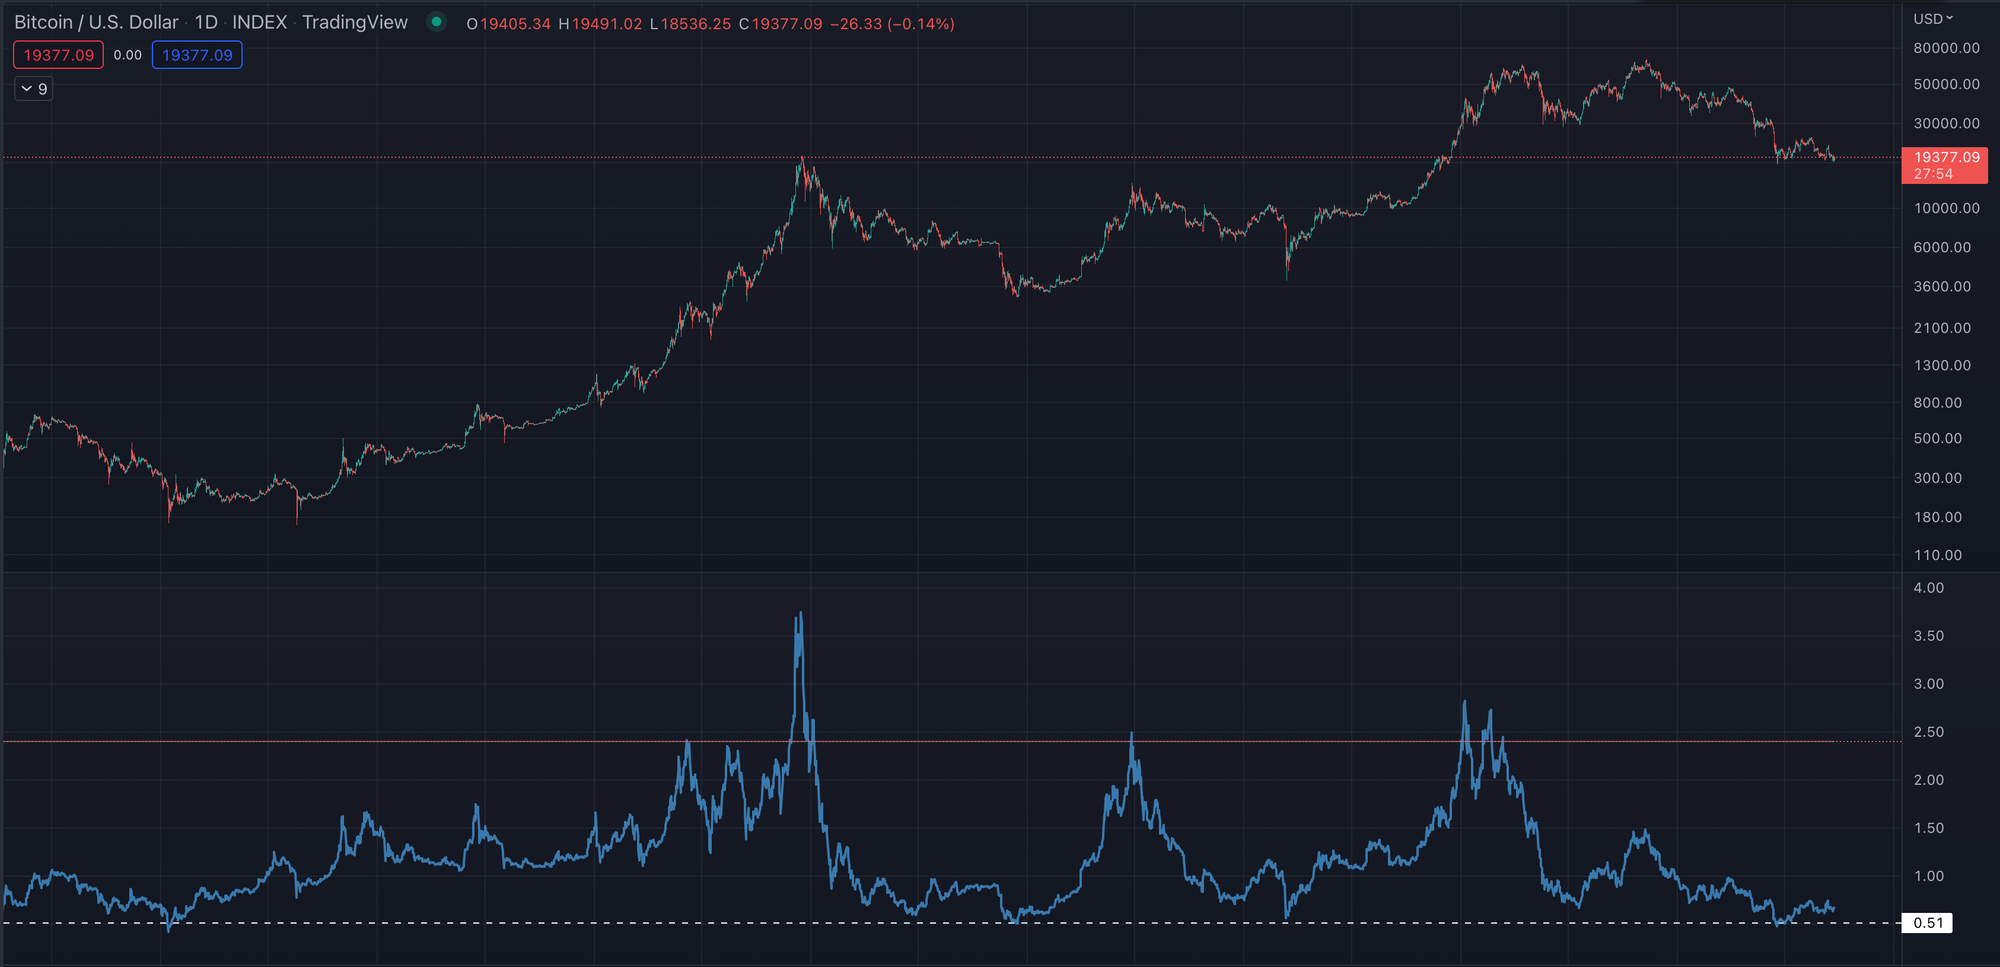
When looking to invest in Bitcoin it is probably wise to look at the Mayer Multiple to see what kind of range we are in, as of writing this article, the Mayer Multiple reached almost record lows in June 2022 where it was under the 0.5 level and Bitcoin's price was at around $17.5k.
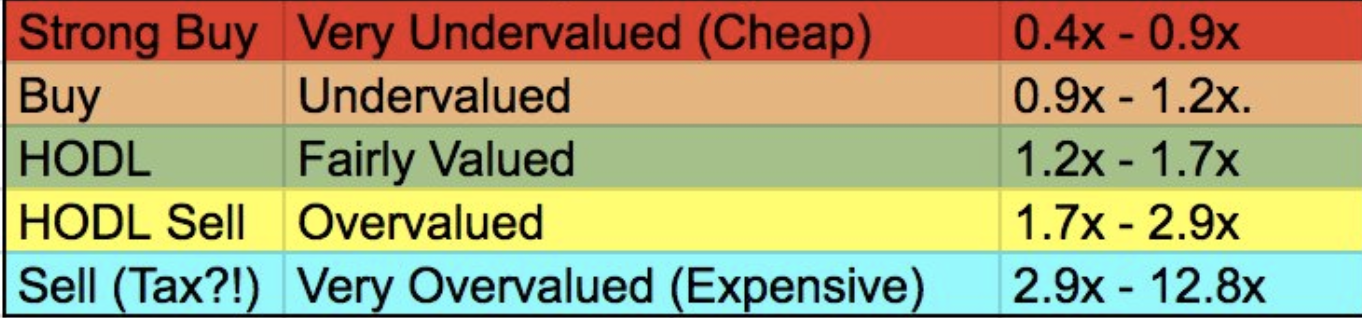
This indicator won't help you leverage trade or time the exact top or bottom, but this will give you a good indication of when to accumulate or distribute. Below are some of the key levels to look out for when making your own investment decisions.
Please note none of this is financial advise and should be taken for educational purposes only.
Trading View - $30 if you upgrade
Join 30 million traders and investors making better, brighter decisions in the world markets, Upgrade your account.
Start your Crypto Journey with Ledger
Ledger is the smartest way to secure, buy, exchange, and grow your crypto assets. Start your journey here.


Discussion