


In this post I am going to talk about an indicator that I haven't seen many people use in the crypto space. The only time I came across the coppock curve when the late Tyler Jenks mentioned it in one of his videos years ago. So what is the coppock curve indicator and how can someone use it?
Lets discuss below..
Firstly, the Coppock Curve is an indicator mainly used for investing, in my experience it will not be useful for day trading as the best timeframe for this indicator is on the weekly and monthly charts to give you clues of major trend changes.
So how is it calculated? The coppock curve takes the Rate of Change (ROC) indicator and smooths it with a weighted moving average (WMA) as this type of moving average focuses more on recent price data than old.
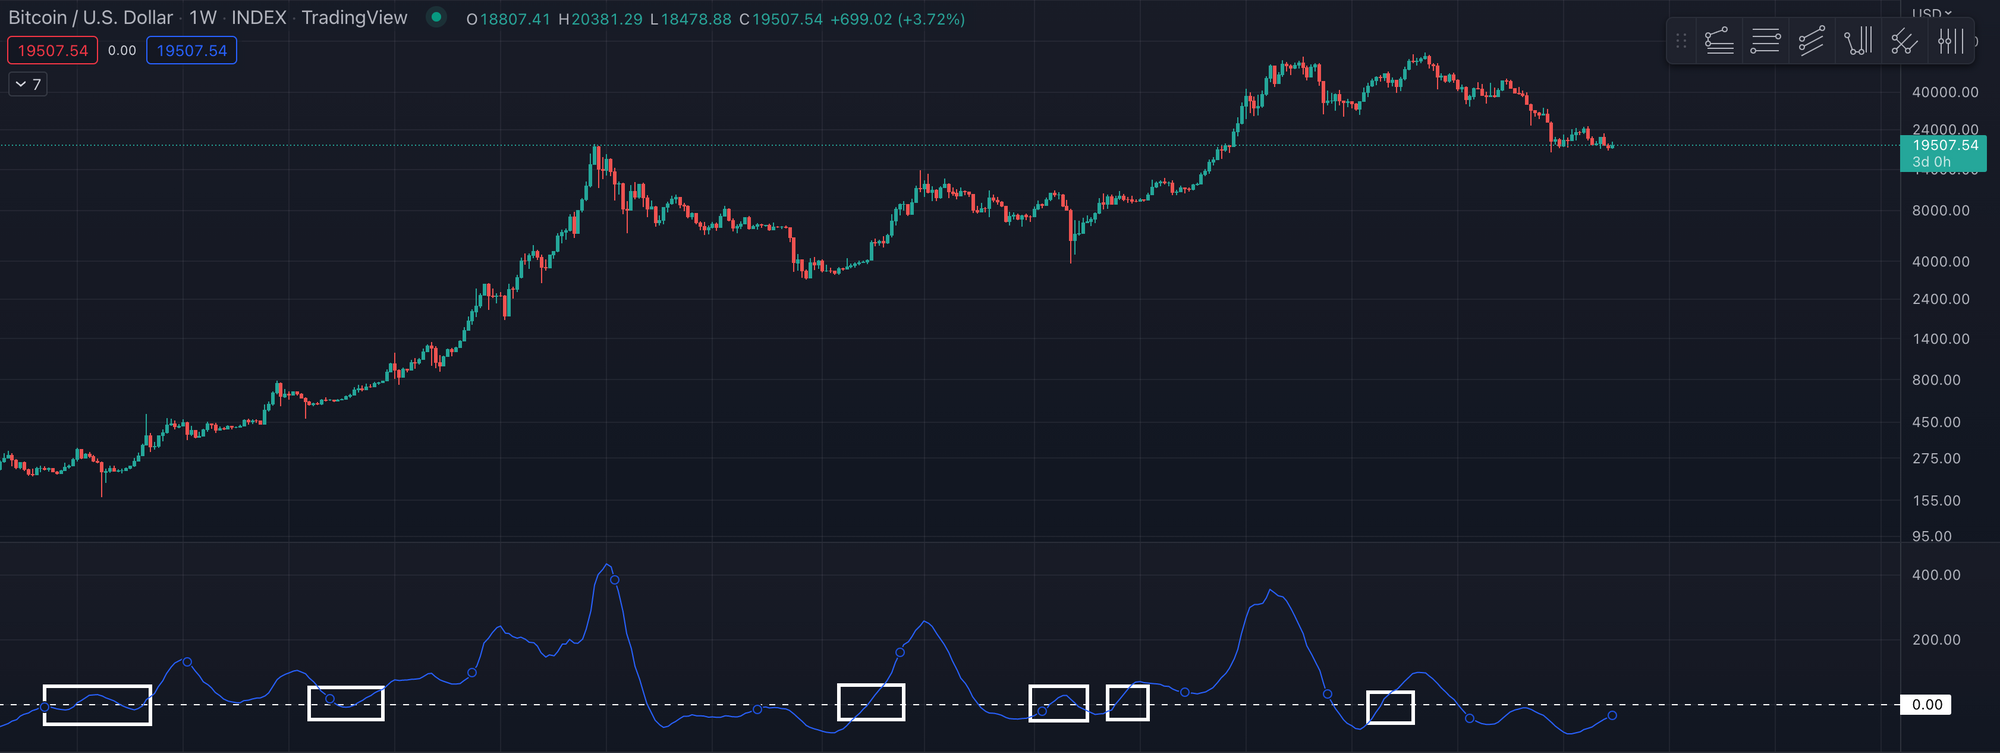
In the chart above which is a Bitcoin weekly chart, the Coppock Curve is the blue indicator at the bottom of the screen and I have added a horizontal zero line in white.
The most important aspect of this indicator is when the blue line crosses above the zero line this signals a bullish trend and we can expect price to go higher. If the blue line fails to cross above the zero line then the trend has not confirmed bullish. This coppock curve is not expected to call exact bottoms but its designed to get you in position for a long sustained bullish movement for weeks and months to come.
As you can see from the chart, there have only been 6 signals since 2015 so it does take a while for trends to change. Also, note that in the 6 signals given, only one I would say was kind of a false signal by the coppock curve and that was in March 2020 due to the Covid crash although the second signal proved to be very profitable.
Currently, the coppock curve is indicating that price is looking to go above the zero line in a few weeks or months, let's see if this proves to be a valid signal.
Please remember never to use an indicator alone, always use it as one part of your analysis to make an informed decision.
I hope you enjoyed this quick tutorial on the Coppock Curve, please comment and share this article and continue to support us!
Trading View - $30 if you upgrade
Join 30 million traders and investors making better, brighter decisions in the world markets, Upgrade your account.
Start your Crypto Journey with Ledger
Ledger is the smartest way to secure, buy, exchange, and grow your crypto assets. Start your journey here.


Discussion