


Looking at the world today it would be foolish to think that the current markets are at place to confidently invest your hard earned cash. So many uncertainties around inflation, energy, jobs, is there really a safe place to park your savings? Let’s look at a few charts below to see where Bitcoin is headed next…
The first chart we need to look at is the DXY, the momentum since May 2021 has been strong coinciding with the all time high of Bitcoin. Currently the DXY is testing the monthly bearish order block created back in September 2002. This area is pivotal...

as a break above this area will lead to a substantial rally therefore plunging the crypto markets into further turmoil. However a rejection from this area could lead to a bottoming pattern for Bitcoin and the crypto asset class, a move below the monthly level of 106.5 will add further confidence to the DXY parabola ending.
Let’s now look at a couple of Bitcoin longer term charts to see if it can give us any clues to see if the markets are close to bottoming.
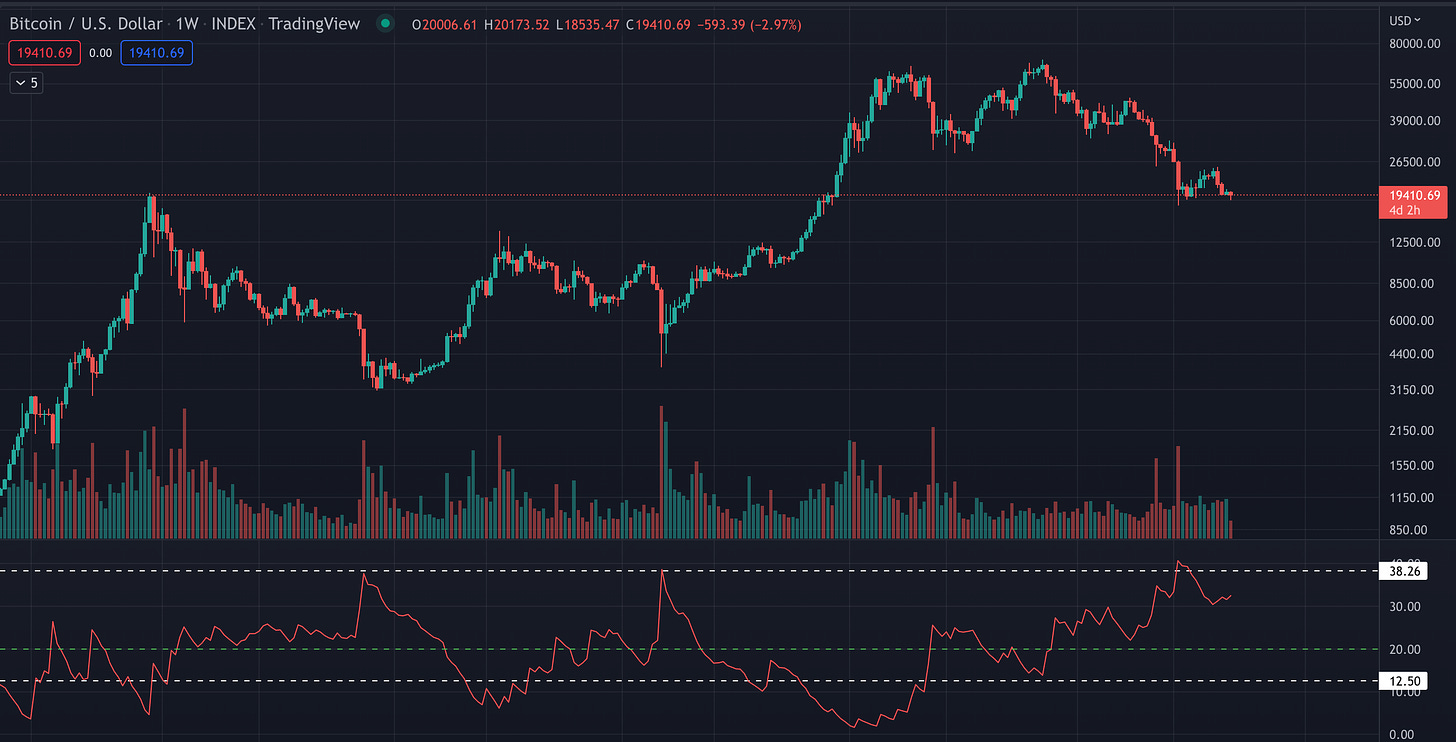
The first chart shows the DI- as the indicator in red which shows the strength of the current downtrend. On a weekly chart, once this indicator shows a reading of at least 38, it typifies that the strength of a downtrend has reached its maximum level. We can see on the chart two confirmed examples back in Nov 2018 and March 2020. Both readings signified selling had reached its peak and a turnaround was soon to follow.
Now let’s look at the current readings, back in June 2022 the DI- again reached its maximum reading of 38 and subsequently weakening as the weeks go on. On the balance of probabilities and history this can signify a reversal is close and a move below 20 would confirm this move.
The next chart I want to us to look at is a longer term view based on market structure. You will never go wrong if you follow this simple technique of support and resistance, as TA can get very confusing and elaborate however, sometimes using the simplest strategies are the most advantageous.
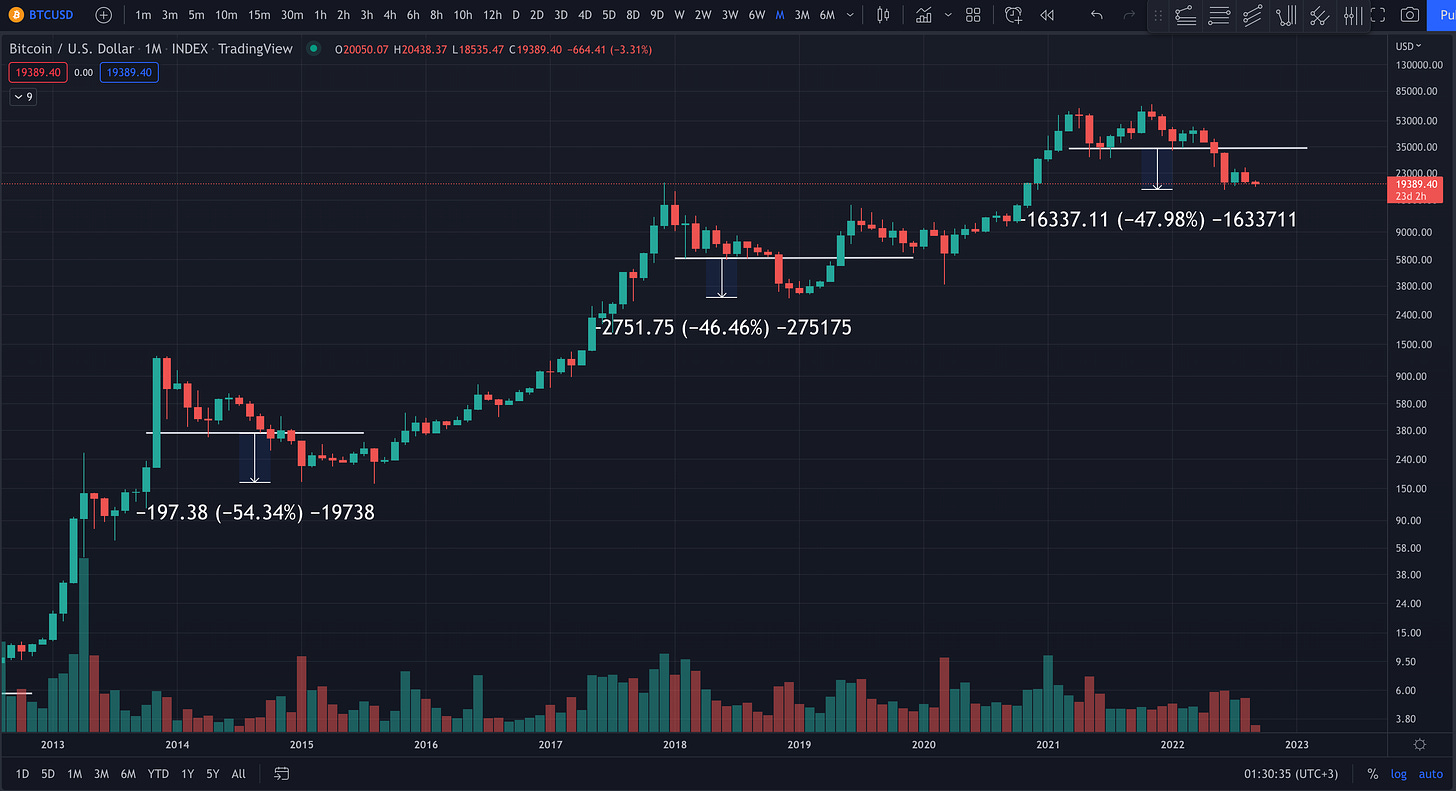
Support and resistance can be drawn on many timeframes depending on how you are trading or investing, as an investor myself and someone who likes to look at the longer term picture, I have drawn these key support and resistance areas on the monthly timeframe. What is fascinating to see is that Bitcoin is following past bear cycles quite closely.
Let me explain further, during the first major bear cycle in 2014, the first significant monthly support was made at around $400 and kept this level for another 8 months or so. As soon as Bitcoin broke this key level it plunged over 50% to its low of $166 a few months later. Now during the 2018 bear cycle this pattern repeated, this time Bitcoin made a local support at that now infamous $6k level for months with many believing this was the bottom. Again after months at this support area it finally broke down almost 50% again to its final bottom of around $3k and an accumulation period happened.
Let’s now look at the current price action, since both all time highs Bitcoin’s main monthly support level has been at that 31-33k level for about a year until it finally broke down in May 2022, so far its crashed about a 50% to $17.5k. The question is now will there be a further crash of 30, 40, 50 percent? Well its never happened before based on a break of monthly market structure but we have to remain vigilant.
So putting all these charts together, there could be case for this period being an accumulation phase especially if the dxy tops out or is close to topping. The dxy will be the main chart to watch in the coming weeks and months for all risk assets.
Gems Research
Unlock the ultimate gateway to cryptocurrency success by subscribing to our exclusive Crypto Gems Database! Gain access to a treasure trove of invaluable insights, hidden opportunities, and untapped potential in the ever-evolving world of digital assets. Our expert team meticulously analyses the market, uncovering the most promising cryptocurrencies poised for explosive growth. Don't miss out on the chance to stay one step ahead of the competition and maximise your profits. Join our community of savvy investors and witness firsthand the power of our Crypto Gems Database. Subscribe now and embark on a thrilling journey towards financial prosperity!
Disclaimer
Please note that the information presented in this review is for informational purposes only and should not be considered as investment advice. It is important to understand that cryptocurrency assets are known for their high market volatility, and engaging in buying, selling, or trading them involves substantial financial risks. It is recommended to exercise caution and conduct thorough research before making any investment decisions. The responsibility for any financial consequences resulting from your actions lies solely with you.
Do you own research.
Want to learn technical analysis and become a better trader in cryptocurrencies?
If this helped you use cost basis the right way, join Alpha Insider for band interactions, pivot rules, and weekly timing windows. Fewer mistakes, cleaner execution, more conviction.
The Markets Unplugged members get:
➡️ Kairos timing windows to plan entries before the crowd moves
➡️ A full DCA Targets page with levels mapped for this cycle
➡️ Exclusive member videos breaking down charts in plain English
➡️ A private Telegram community where conviction is shared daily
➡️ A dedicated Bitcoin On-Chain Analysis page with regularly updated analysis and monthly reports (MVRV, SOPR, NUPL, Puell, URPD)
It’s the full playbook.


Discussion