


Key Points
- SOPR (Spent Output Profit Ratio) measures whether coins spent on-chain were realised in profit or realised in loss.
- SOPR above 1 means the average coin moved at a profit. SOPR below 1 means the average coin moved at a loss. SOPR at 1 is breakeven.
- It is most useful as a behaviour gauge around the 1.0 line, separating trend absorption from distribution pressure.
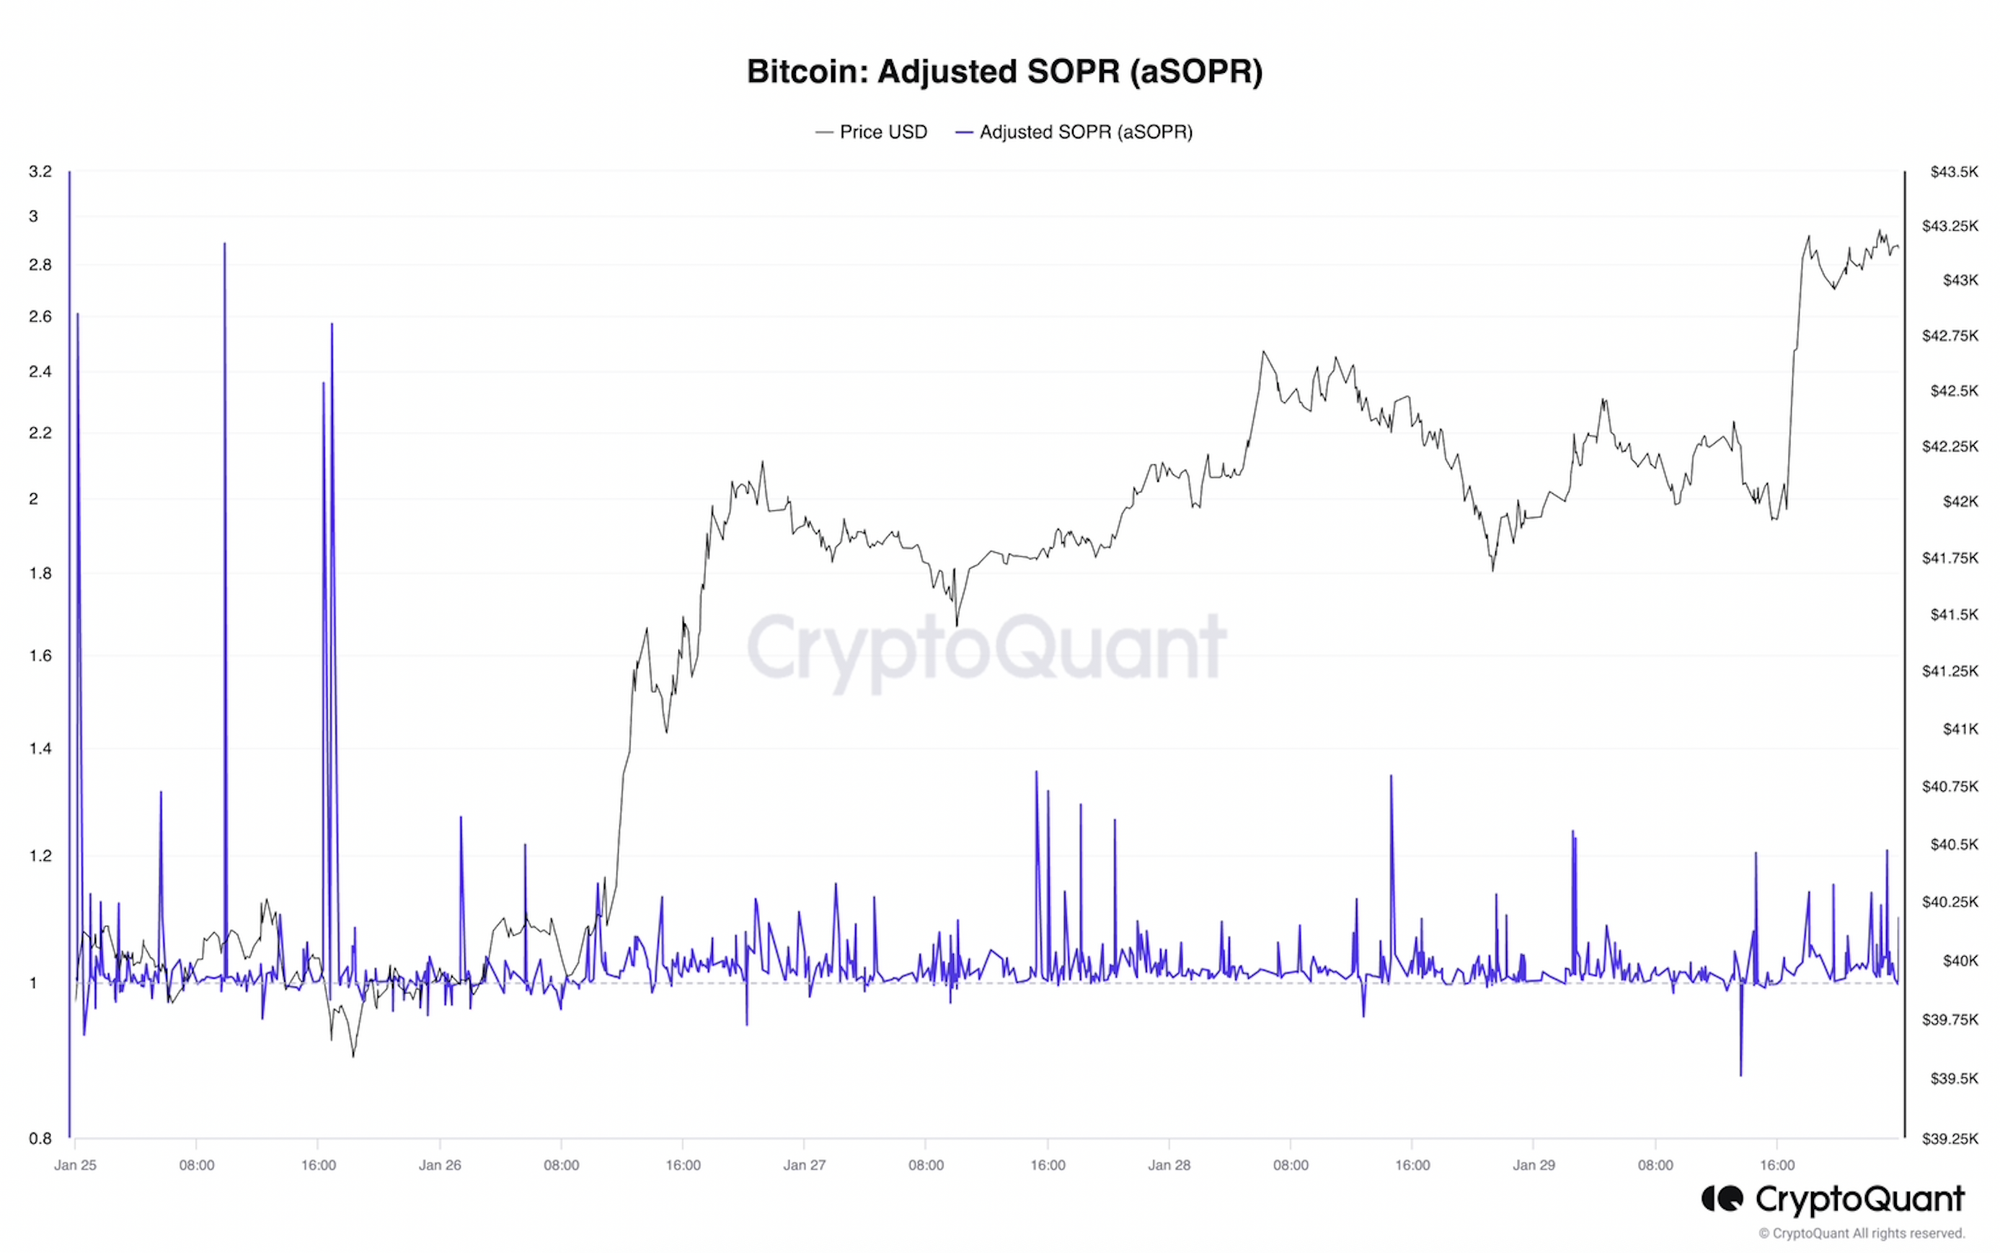
- Adjusted SOPR (aSOPR) filters very young outputs, which usually makes regime reads cleaner than raw SOPR.
- Use SOPR as context and confirmation, then cross check with cost basis, realised profit and loss, and spending age indicators before forming a view.
- This guide is part of the Bitcoin on-chain series. For the full library of indicators and explainers, see the Bitcoin on-chain indicators hub.
- If any terms feel unfamiliar, use the Crypto Glossary, then return here.
Quick Answer
SOPR measures whether Bitcoin being spent on-chain is being realised in profit or in loss, by comparing the value when coins were created with the value when they are later spent. When SOPR holds above 1.0, profit-taking is being absorbed and trend conditions often persist. When SOPR stays below 1.0, losses are being locked in and the 1.0 level often acts as resistance. Use aSOPR on a weekly view for cleaner regime context, then confirm with realised price bands and profit and loss data before drawing conclusions.
What Is SOPR?
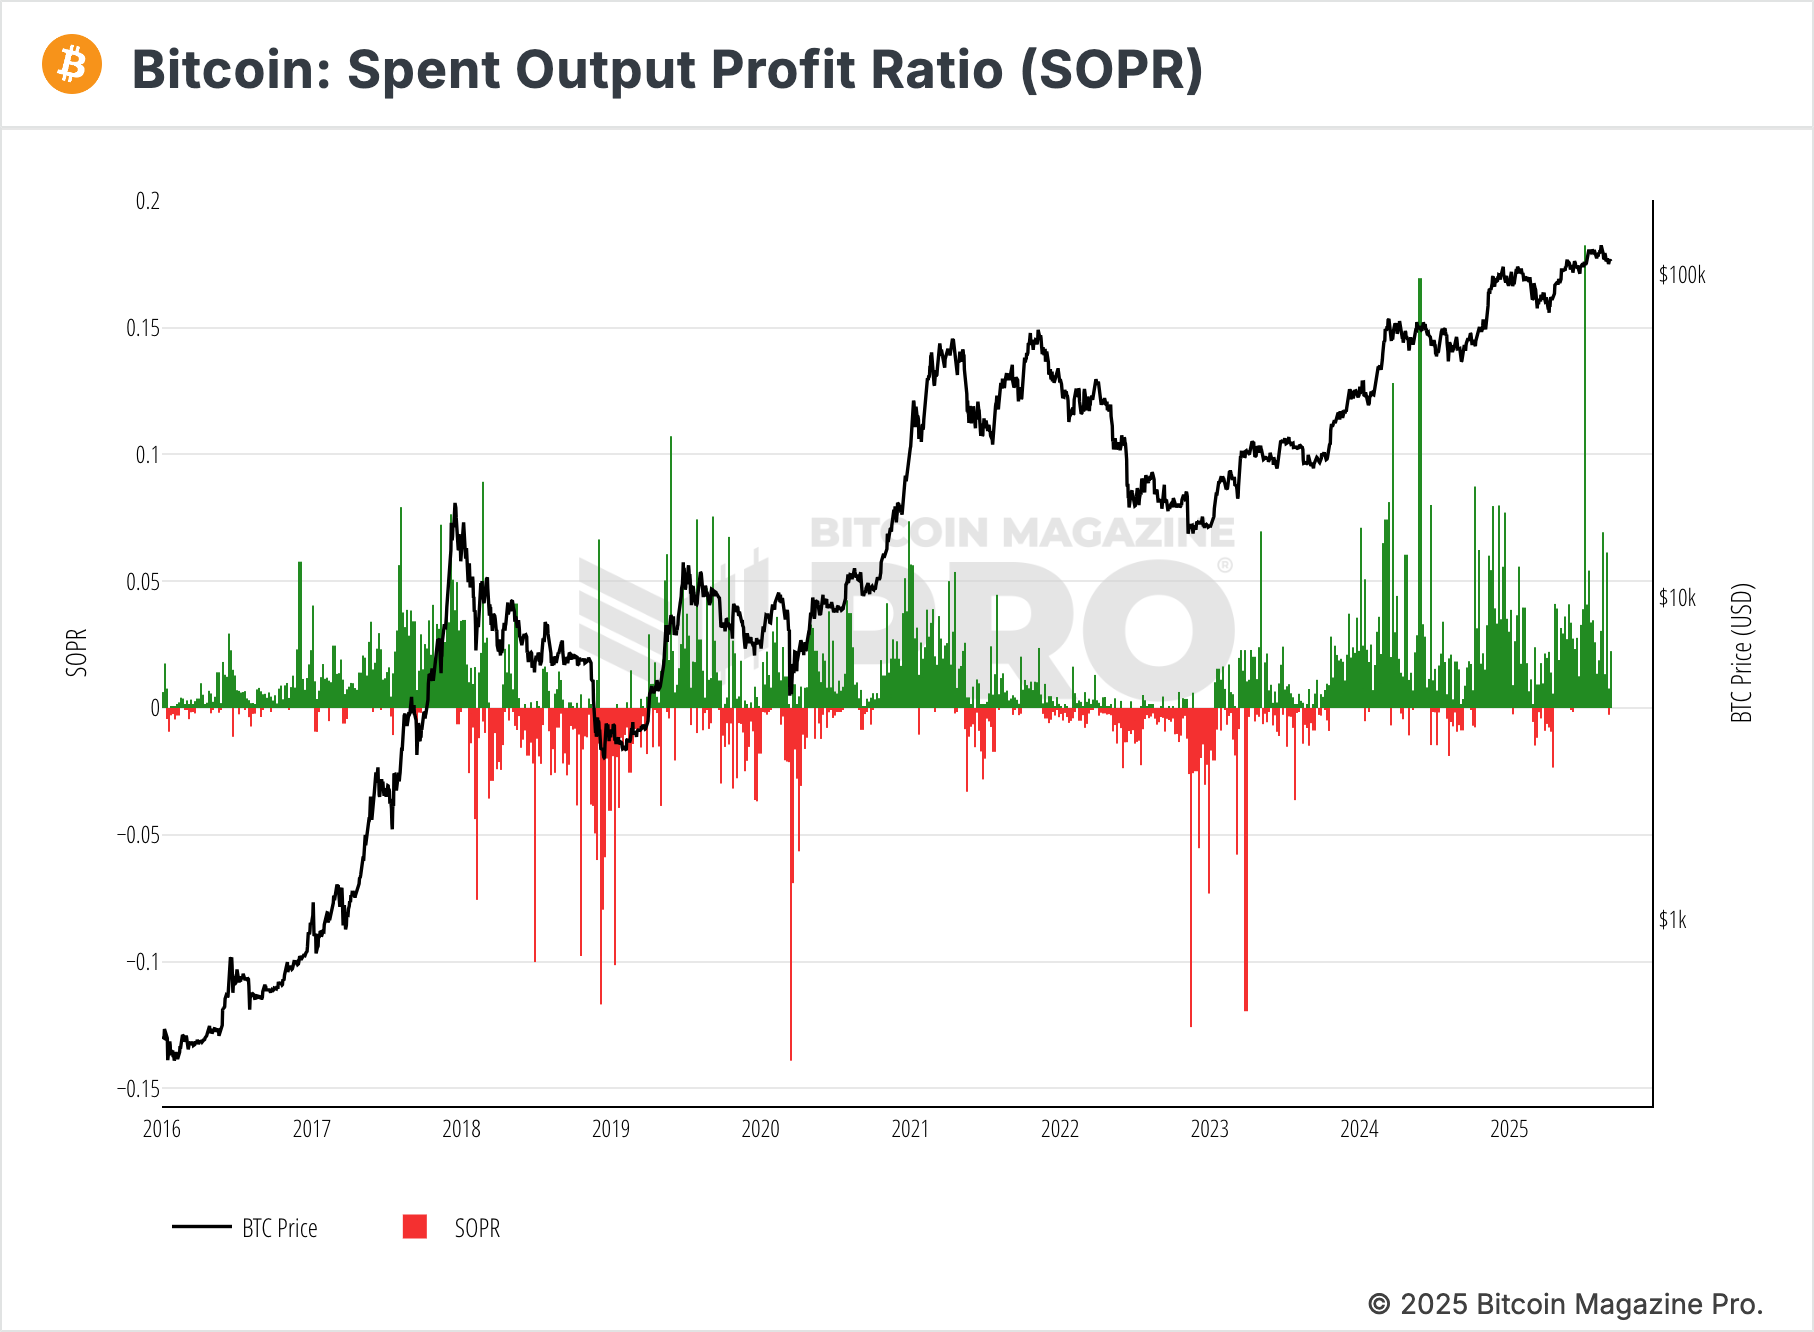
SOPR measures whether coins spent on-chain were sold in profit or at a loss. It compares the value at the time coins were created with the value when they are later spent.
SOPR > 1 means the average coin moved at a profit. SOPR < 1 means the average coin moved at a loss. SOPR = 1 is breakeven.
This view smooths noise and shows how profit and loss regimes shift across cycles.
How Is SOPR Calculated?
- Take all spent outputs in a period (for example, daily).
- For each, compare the value when it was created with the value when it is spent.
- Aggregate those ratios to produce SOPR for the period.
Adjusted SOPR (aSOPR) filters very young outputs to reduce self-spends and intraday noise. Many analysts prefer aSOPR with a 7-day average on a weekly chart.
Why SOPR Matters
- It shows behaviour, not just price… are participants realising gains or taking losses?
- It helps separate healthy trend absorption from distribution.
- It provides timely feedback at pullbacks and rallies around the 1.0 line.
Interpreting the 1.0 Line
- Above 1.0 and rising: profits are being realised and absorbed. Trend conditions often persist.
- Retests of 1.0 from above: common in advances; holding 1.0 suggests dips are being bought.
- Below 1.0 and fading: losses are being locked in. In downtrends, 1.0 often acts as resistance.
- Whipsaws around 1.0: look for confluence before acting.
Key Variants You’ll Use
- aSOPR: adjusted version that filters very young outputs; best for regime reads.
- STH-SOPR: short-term holders (≤ 155 days). Sensitive to swings; good for spotting pressure on newer buyers.
- LTH-SOPR: long-term holders (≥ 155 days). When this rises strongly, it can indicate older supply is distributing.
Practical Use With Confluence
- Pair SOPR with Realised Price Bands (Market, LTH, STH). If aSOPR holds above 1.0 while price is near Market or STH Realised Price, pullbacks often get absorbed.
- Cross-check with Realised Profit/Loss. A surge in realised profit alongside falling price flags distribution; the inverse can suggest absorption.
- Add Dormancy or CDD to see if old coins are driving the move.
Common Pitfalls
- Using raw SOPR intraday: very noisy. Prefer aSOPR with smoothing.
- Treating 1.0 as an instant trigger: wait for confirmation with price and other indicators.
- Ignoring cohort context: STH pressure is different from LTH distribution.
- Forgetting on-chain scope: SOPR reflects on-chain movements; some activity sits off-chain.
A Simple Workflow You Can Reuse
- Open aSOPR (7D) on weekly. Note regime relative to 1.0 and direction of travel.
- Check STH-SOPR for stress on recent buyers; glance at LTH-SOPR for older supply participation.
- Compare price with Market/LTH/STH Realised Price.
- Inspect Realised Profit/Loss and Dormancy/CDD for confirmation.
- Decide: trend absorption holding above 1.0, or distribution risk pressing below 1.0.
Mini FAQs
What does SOPR tell you in simple terms?
It shows whether coins being spent on-chain are being realised in profit or in loss, which helps reveal selling behaviour beneath price.
Why do many analysts use aSOPR instead of SOPR?
aSOPR filters very young outputs, which reduces noise from self-spends and short-term reshuffles.
How should the 1.0 level be interpreted?
Above 1.0, profit-taking is being absorbed more easily. Below 1.0, loss-taking is dominating and 1.0 often becomes resistance in downtrends.
Is SOPR a buy or sell signal?
No. It is a behaviour layer. It works best when confirmed with cost basis, realised profit and loss, and flow indicators.
Which SOPR variants matter most?
aSOPR for cleaner regime reads, STH-SOPR for stress on newer buyers, and LTH-SOPR for signs older supply is distributing.
How often should SOPR be checked?
Weekly is usually enough for most readers. Daily checks can add noise unless the regime is already clear.
If this helped you read profit and loss behaviour properly, Alpha Insider members can access deeper Bitcoin on-chain analysis and commentary here.
Alpha Insider members get:
➡️ Kairos timing windows to plan entries before the crowd moves
➡️ A full DCA Targets page with levels mapped for this cycle
➡️ Exclusive member videos breaking down charts in clear, simple terms
➡️ A private Telegram community where conviction is shared daily
Built for a clearer weekly view.
Legal And Risk Notice
This content is for education only and does not constitute financial advice. Crypto assets are volatile and you can lose money. Always do your own research and consider your risk tolerance.


Discussion