


Key Points
- AHR999 turns Bitcoin’s distance from the 200-day average into three valuation zones, so you can see deep value, core accumulation and overheated conditions at a glance.
- Readings well below the lower band have historically aligned with value zones where staged buying has worked once downside momentum slows.
- The middle band maps a fixed-investment range where dollar-cost averaging and trend-following tend to behave cleanly.
- Extended time in the upper band signals a hotter tape where gains can continue but drawdown risk rises and pullbacks are sharper.
- AHR999 is most useful when paired with the 200-day trend and other on-chain indicators rather than used as a lone buying or selling trigger.
- This guide is part of the Bitcoin on-chain series. For the full library of indicators and explainers, see the Bitcoin on-chain indicators hub.
- If any terms feel unfamiliar, use the Crypto Glossary, then return here.
Quick Answer
AHR999 is a valuation framework that compares Bitcoin price to the 200-day moving average and groups that relationship into zones. Lower-zone conditions have historically aligned with depressed regimes where risk is often lower once selling pressure cools. Middle-zone conditions tend to align with more neutral, trend-friendly regimes. Upper-zone conditions tend to align with hotter markets where upside can continue but drawdown risk increases. Use AHR999 as a regime anchor, then confirm with cost basis and behaviour indicators before forming a view.
What Is The Bitcoin AHR999 Indicator And Why It Helps
AHR999 is a long-horizon valuation index built from Bitcoin’s price relative to its 200-day moving average. Instead of giving you a single ratio to interpret, it groups that relationship into three zones that correspond to deep value conditions, a neutral fixed-investment band, and a hotter, higher-risk region near cycle extremes.
By compressing a lot of historical behaviour into those bands, AHR999 gives you a simple context: is the current market cheaper than usual, broadly neutral, or pushing into territory where past cycles have run hot. It is designed to guide position sizing and expectations, not to tell you the exact day to buy or sell.
If any of the on-chain or technical terms in this guide feel unfamiliar, it can help to keep The Markets Unplugged Bitcoin And Crypto Glossary open in another tab while you read.
How The AHR999 Index Is Constructed
At its core, AHR999 tracks how far Bitcoin’s price sits above or below the 200-day moving average and then normalises this relationship across history. Practitioners typically use three broad regions.
- When AHR999 is well below roughly 0.45, the market is in a depressed zone where price has spent little time historically. These periods tend to cluster around deep value phases and late capitulation.
- When AHR999 is between roughly 0.45 and 1.20, Bitcoin trades in a fixed-investment band. In this range, systematic dollar-cost averaging and trend-following approaches have generally behaved in a stable way across cycles.
- When AHR999 spends sustained time above roughly 1.20, the tape is running hotter. Upside can continue, but risk and volatility increase and pullbacks tend to be sharper.
The power of the index is the banding. Instead of fixating on an exact reading, you concentrate on which zone you are in and how long price has been there.
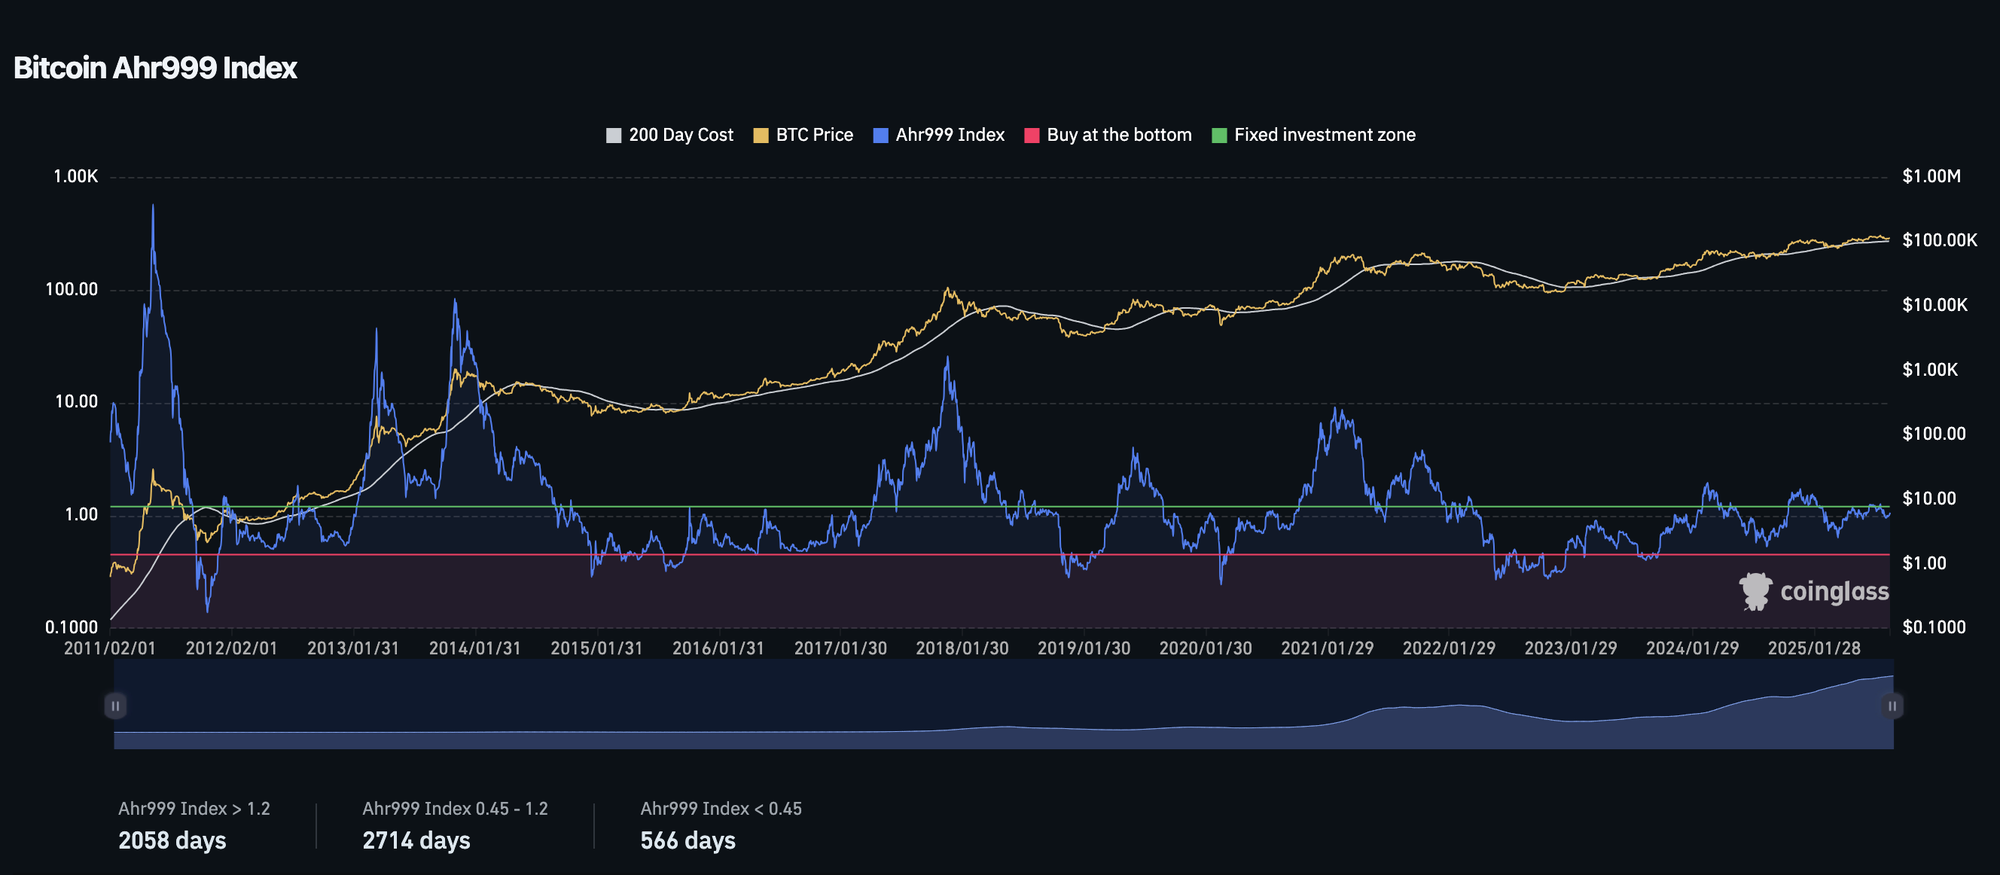
This chart plots the AHR999 line with guides around 0.45 and 1.20 alongside Bitcoin’s price and the 200-day moving average. Extended stretches below the lower band align with deep value regions during past bear markets, while persistent time above the upper band lines up with late-stage heat close to cycle peaks.
Practical Thresholds For AHR999
AHR999 works best as a set of guide rails, not as a mechanical rule. The following thresholds are a practical way to read the bands.
- AHR999 below 0.45 – value zone
Market conditions are historically depressed. It can make sense to plan staged entries as selling pressure cools and other indicators show exhaustion. - AHR999 between 0.45 and 1.20 – core accumulation band
This is the fixed-investment region. Dollar-cost averaging, adding on pullbacks that hold near or above the 200-day average, and maintaining a core allocation tends to work cleanly here. - AHR999 above 1.20 – risk management zone
The tape is hotter and risk-reward compresses. Gains can continue, but it becomes more important to manage position size, take profit into strength and be selective with new exposure.
Short, fast moves around a threshold are often noise. It usually pays to step back to the weekly chart and look for persistence before you change your stance.
Pairing AHR999 With The 200-Day And Other Indicators
AHR999 is most effective when you combine it with the 200-day moving average and a small set of other on-chain dials.
- When AHR999 is rising and price is above a rising 200-day, the backdrop is broadly trending. Adding on pullbacks that respect the 200-day tends to be cleaner.
- When AHR999 is above 1.20 at the same time as indicators such as VDD or CDD show spikes in old-coin spending, it can flag distribution into strength. That is often a good time to reduce risk rather than chase.
- When AHR999 is below 0.45 and the realised PnL ratio turns back above one, it suggests that forced sellers have largely cleared and new buying is emerging, which supports staged re-risking.
- If AHR999 drifts lower while Bitcoin dominance rises, it can be a signal that speculative altcoin exposure should be reviewed and tightened.
The goal is to build a small dashboard where AHR999 acts as the long-horizon valuation anchor, while other indicators confirm whether behaviour is consistent with accumulation or distribution.
What The AHR999 Bands Usually Suggest About Market Context
You do not need the precise current value of AHR999 to make use of the framework. What matters is how price behaves around the bands over time.
- When the index spends most of its time in the fixed-investment band with only brief moves higher, the market is often in a healthy trend. Pullbacks towards the 200-day average can be treated as opportunities if breadth and on-chain data remain constructive.
- When AHR999 repeatedly pushes into the upper band without making convincing new highs in price, that can hint at distribution, as rallies are used to sell into strength.
- When the index has been depressed for an extended period below the lower band, and then starts to recover back into the middle band while realised profit and loss measures improve, it often marks the transition from capitulation to rebuilding.
Thinking in terms of these regimes helps you adjust expectations, so you are not surprised when volatility and drawdown risk increase near the top of the range.
A Weekly AHR999 Workflow You Can Reuse

- You can fold AHR999 into a simple weekly routine that does not take much time.
- Mark where AHR999 sits relative to the lower and upper bands and note the slope of the 200-day moving average.
A small, consistent routine built around AHR999 helps you treat cycle risk systematically, rather than letting short-term noise dictate your decisions.
Mini FAQs
Q: Is AHR999 just the 200-day ratio with labels?
A: AHR999 is based on the relationship between price and the 200-day average, but the power comes from the way that history is grouped into zones. The banding turns a moving average into a cycle map so you can act consistently rather than guessing where you are each time.
Q: Does AHR999 above the upper band mean it is time to sell everything?
A: No. A reading in the upper band is a heat warning, not an automatic exit signal. It tells you that the market is richer than usual and that it is sensible to manage position size, take profit into strength and be more selective with new exposure.
Q: Can AHR999 be applied to altcoins as well as Bitcoin?
A: You can build a similar ratio for larger altcoins, but liquidity, volatility and cycle structure differ from Bitcoin. It is usually better to combine any altcoin version with dominance and sector breadth data rather than relying on AHR-style bands alone.
Q: How often should I check the AHR999 indicator?
A: Because it is a long-horizon tool, weekly or monthly checks are enough. Looking at it too frequently can encourage over-trading and make it harder to see the underlying regime.
Q: What are the main limitations of AHR999?
A: Like all valuation models, AHR999 is based on past behaviour. The bands can be stretched in unusual macro environments and there is no guarantee that price will react in the same way every cycle. It should be one input in a broader process that includes risk management and time horizons.
If this helped you turn a long-term average into a clear plan, Alpha Insider members can access deeper Bitcoin on-chain analysis and commentary here.
Alpha Insider members get:
➡️ Kairos timing windows to plan entries before the crowd moves
➡️ A full DCA Targets page with levels mapped for this cycle
➡️ Exclusive member videos breaking down charts in clear, simple terms
➡️ A private Telegram community where conviction is shared daily
Built for steadier weekly context… updated week to week.
Legal And Risk Notice
This content is for education only and does not constitute financial advice. Crypto assets are volatile and you can lose money. Always do your own research and consider your risk tolerance.


Discussion