


What Are Breakevens… and what do TIPS have to do with it?
- Breakeven inflation is the market-implied average inflation over a maturity - computed as nominal Treasury yield minus TIPS real yield.
- TIPS (Treasury Inflation-Protected Securities) compensate investors for CPI inflation via principal indexation.
- So when the 5-year breakeven prints 2.3%, the bond market is effectively pricing ~2.3% average CPI over the next five years… give or take risk premia.
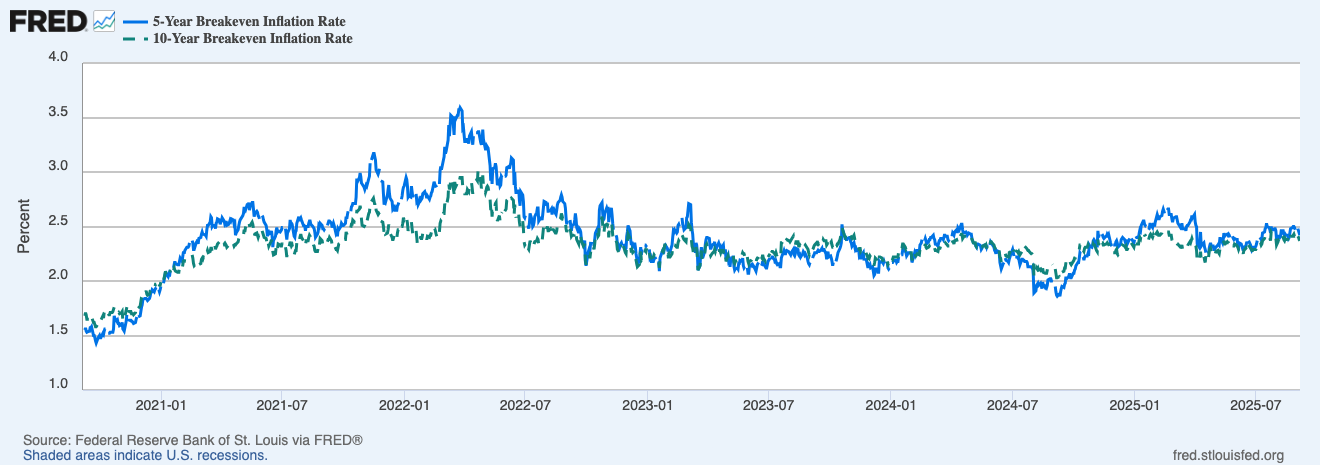
Overlay of 5y (solid) and 10y (dashed) breakevens since 2020… shows the inflation scare, the cool-off, and how the curve shape has evolved.
Why 5y and 10y matter
- 5y breakeven = nearer-term psychology… sensitive to energy, growth wobbles, and policy surprises.
- 10y breakeven = longer-run anchor… drifts slower; closer to what policy makers want to see.
- Spread (5y – 10y):
- Positive → market sees more inflation pressure short-run than long-run (classic post-shock pattern).
- Negative/flat → nearer-term pressure fading or long-run anchor drifting up.
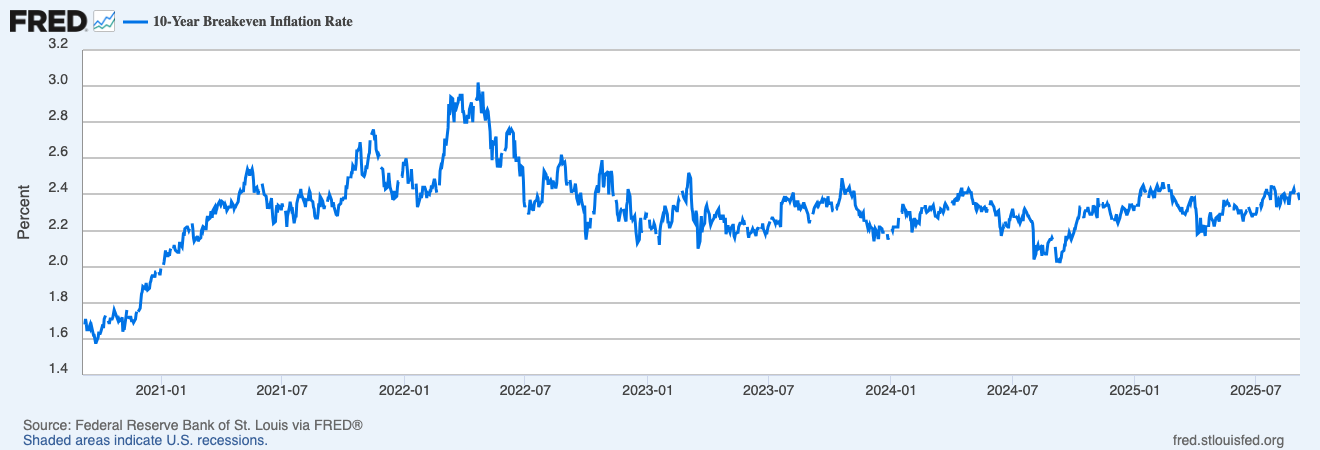
Single series for the long-run anchor - smoother than 5y and a better guide to whether expectations are settling near the Fed’s target zone.
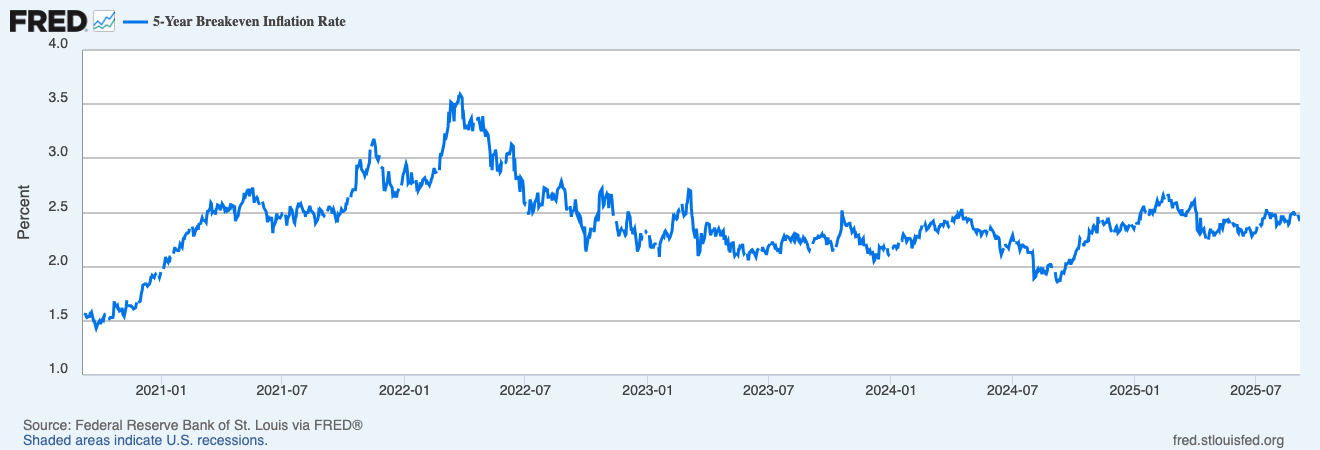
Short-run expectations - more volatile… reacts first to oil spikes, growth scares, and data surprises.
How to read moves… without overthinking it
- Step-ups into data (CPI/PCE week): the 5y often twitches first; if the 10y stays calm, the market sees transitory heat.
- Parallel rises (both 5y and 10y): broad repricing of inflation risk - watch real yields and the dollar; crypto beta can feel it.
- 5y rolls over while 10y holds: short-run pressures cooling… supportive for duration assets.
- 10y drifts higher for weeks: the long-run anchor is loosening… policy tone tends to harden.
Watch-outs (the fine print that trips people up)
- Risk premia & liquidity: breakevens aren’t pure expectations; TIPS liquidity, seasonality and carry can nudge levels.
- CPI vs PCE: TIPS settle on CPI… policy targets PCE; small wedge is normal.
- Energy sensitivity: the 5y can overreact to oil - check whether the 10y agrees before you call a regime change.
- Indexation lag: mechanical features of TIPS mean near-term prints can pick up technical distortions.
A simple workflow you can reuse
- Open 5y vs 10y breakevens on FRED; note direction and the spread.
- Check real yields (TIPS 10y) - is the move inflation-led or real-rate-led.
- Cross-check oil and DXY for macro drivers.
- Into CPI/PCE weeks… watch 5y in the 48 hours before the print; after the release, confirm with the 10y.
- Map risk: sustained rises in both breakevens + rising real yields = tighter financial conditions… size accordingly, no faffing.
Mini FAQs
Are breakevens a forecast?
They’re a market price that blends inflation expectations, risk premia, and TIPS plumbing - still the cleanest real-time gauge we have.
What’s better - 5y or 10y?
Use both. 5y for near-term heat; 10y for the anchor. The shape is the story.
Should I compare to the 2% target?
Yes. A 10y breakeven parked near ~2% says the anchor is intact; persistent drift above says the market doubts a neat return to target.
If this helped you read inflation expectations like a pro, join Alpha Insider for Macro Heat dashboards, calendar previews for key prints, and a weekly positioning watchlist. Fewer mistakes, cleaner execution, more conviction.
The Markets Unplugged members get:
➡️ Kairos timing windows to plan entries before the crowd moves
➡️ A full DCA Targets page with levels mapped for this cycle
➡️ Exclusive member videos breaking down charts in plain English
➡️ A private Telegram community where conviction is shared daily
➡️ A dedicated Macro Analysis page with regularly updated analysis and monthly reports (inflation, yields, liquidity, dollar)
It’s the full playbook.


Discussion