On-chain and alt-sector research at The Markets Unplugged. Creator of the Bitcoin Barometer, Ethereum Barometer, Alt Sector Radar and ETH Rotation Index.
Host of the Crypto Unplugged podcast.
Realised PnL Ratio compares realised profits to realised losses, showing whether profit-taking or capitulation is dominating on-chain.
It is a behaviour metric based on completed spending, not paper gains, so it reads as a cleaner sentiment gauge during extremes.
Higher readings mean realised profits outweigh realised losses, often aligning with stronger risk appetite and distribution phases.
Lower readings mean realised losses outweigh realised profits, often aligning with stress regimes and capitulation windows.
The strongest value is in persistence and regime shifts, not a single spike. Watch whether profit or loss dominance holds for weeks.
Confirm with cost basis and positioning context: realised price bands, MVRV, NUPL, SOPR, and exchange flows.
Weekly reads are usually enough for most readers. Daily prints can be event-driven noise.
Quick Answer
Realised PnL Ratio shows whether Bitcoin holders are locking in more profits than losses when they spend coins on-chain. When the ratio stays elevated, profit-taking is dominating and the market is digesting gains, which can increase late-cycle risk if other distribution indicators confirm. When the ratio stays depressed, losses are dominating and capitulation pressure is higher, which can align with stress regimes and late-bear exhaustion when it persists. Use it as a timing filter for behaviour, then confirm with cost basis and flow indicators before forming a view.
It is the ratio of realised profits to realised losses on-chain over a chosen window. Above 1.0 means more profit is being taken than loss. Below 1.0 means losses dominate. Direction and persistence matter more than any single tick.
The midline near 1.0 is the key bias guide. Reclaimed and held above it reads as a constructive signal. Persistent sub-1.0 readings indicate stress.
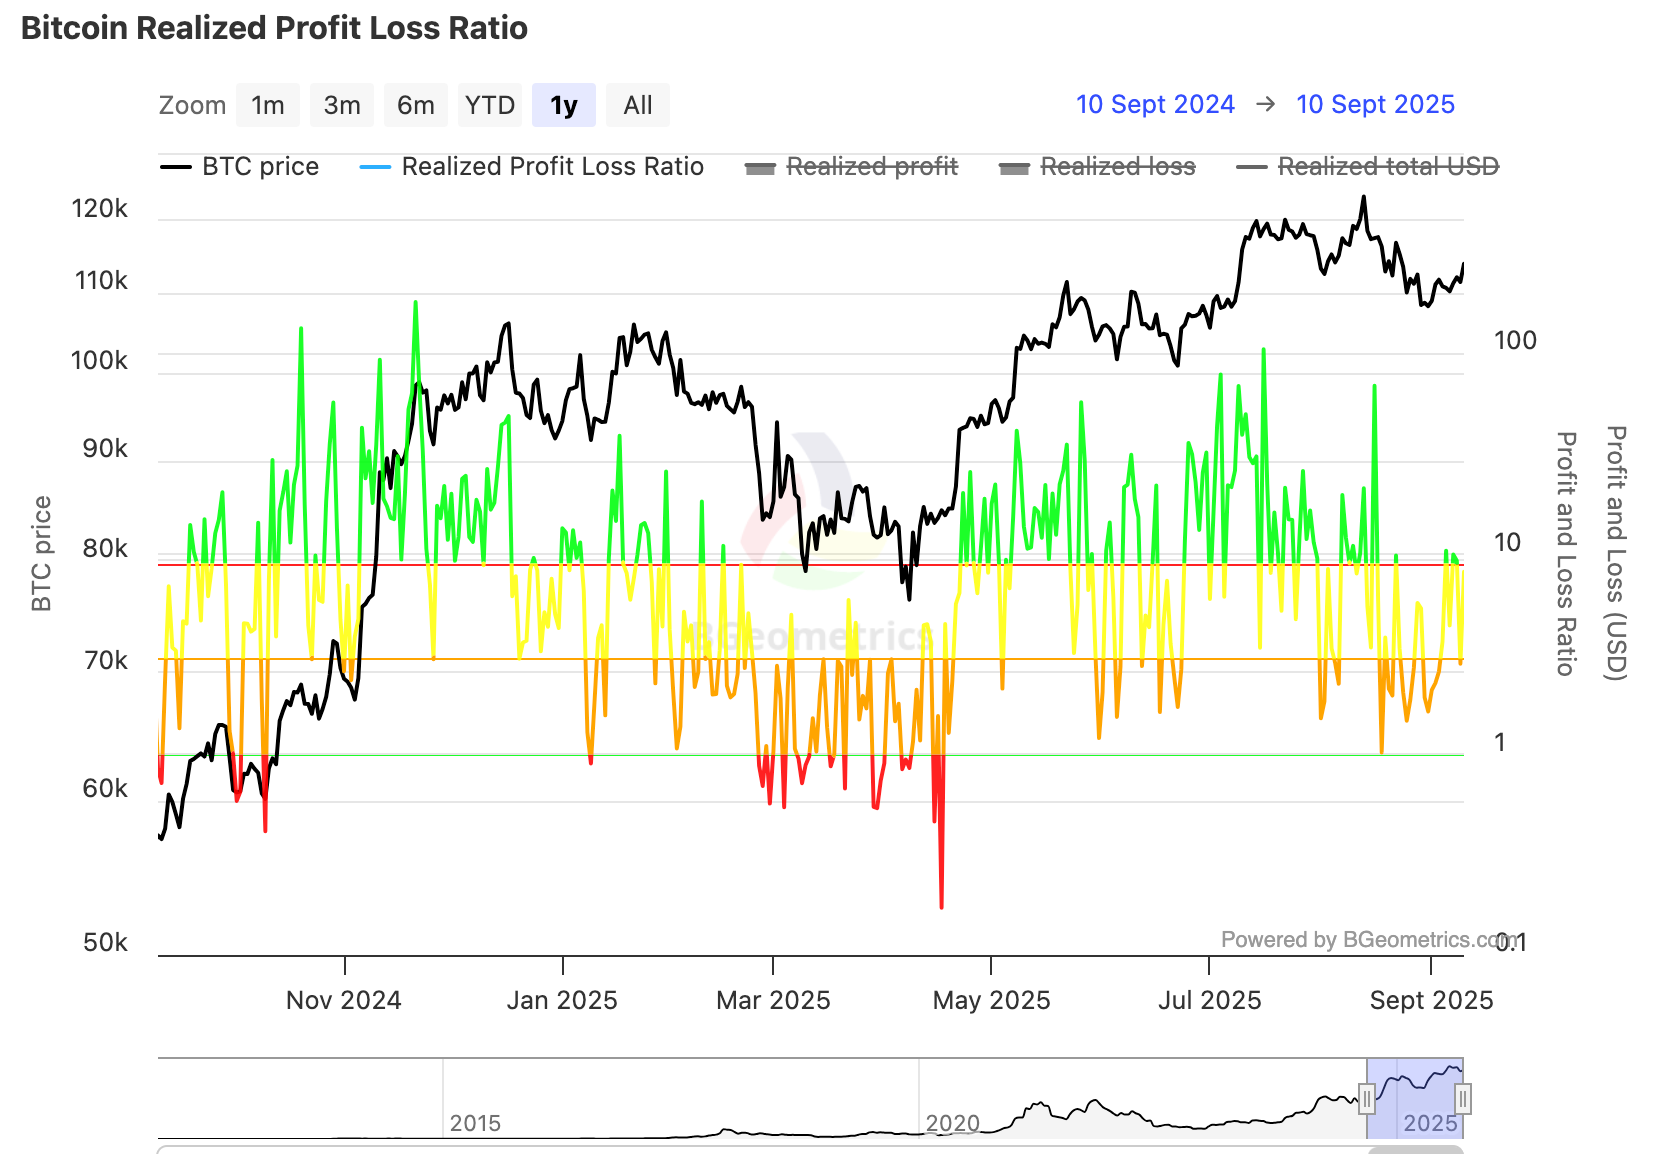
Bitcoin Realised Profit/Loss Ratio, 1-year with price. Source: BGeometrics.
The 90-Day Heatmap: Reading Regime At A Glance
The heatmap compresses day-by-day swings into a quick read of regime. Green clusters show profit-dominant periods. Orange or red clusters show loss-dominant clean-ups. It is a fast way to see whether pullbacks are simple shakes or turning points.
Alternating bands are normal. Brief red streaks inside a mostly green quarter often resolve as digestion, not breakdown.
Clean reclaim and hold above 1.0 for several sessions: buyers are absorbing supply and taking profits without reversing the regime.
Sharp profit spikes well above the usual range while price stalls: heavy distribution is likely. Expect digestion or pullback risk.
Persistent sub-1.0 prints: loss realisation is dominating. Stand aside or wait for a decisive reclaim before adding exposure.
Flip-flop around 1.0 with small amplitudes: noise. Defer decisions to the weekly read.
Practical Thresholds
Guide rails, not gospel. Pair with price and other indicators.
Loss Dominant
Sub-1.0 running for several sessions
Loss clean-up is underway. Wait for a confirmed regain. Adding exposure into persistent loss dominance increases the risk of catching a deteriorating regime.
Regime Shift
Reclaim of 1.0 after a red cluster
Acts as a timing filter. The reclaim needs to hold across two or three sessions to carry weight. A single-day flip is not enough.
Distribution Risk
Repeated profit spikes without price progress
Heavy supply absorption is likely. Repeated spikes while price stalls suggest the market is working through significant overhead. Reassess exposure into that pattern.
Exhaustion Pattern
Deep loss spike, then swift flip back above 1.0
Classic capitulation-and-reset behaviour. A sharp loss spike followed quickly by a return above 1.0 suggests exhaustion rather than sustained breakdown.
How To Pair RPLR With Other Indicators
No single on-chain metric reads well in isolation. RPLR is most useful when it confirms what cost basis and flow indicators are already suggesting.
Constructive confluence: RPLR back above 1.0 with SOPR above 1.0. Spending is in profit and being absorbed by the market. Risk appetite is constructive. Cross-check with realised price bands and MVRV for cost basis context.
Patient read: RPLR sub-1.0 with miner-to-exchange flows quiet. Likely a loss clean-up rather than accelerating distribution. Watch for the reclaim rather than overreacting to the loss prints.
Risk contracting: RPLR slipping under 1.0 while funding rates cool and open interest fades. Risk appetite is unwinding across multiple indicators. More caution is warranted.
Late-cycle read: RPLR firm above 1.0 but MVRV stretching and RHODL heating. Profit dominance is coinciding with late-cycle valuation signals. Distribution risk is rising even when the ratio looks constructive.
What The Charts Are Saying Now
The 1-year view shows green surges on pushes to new highs, with red clusters concentrated around the spring drawdown. The recent quarter's heatmap leans green with short red streaks. That fits a market that is pausing, not breaking. Use dips, then add when the ratio flips back above 1.0 and holds.
A Simple Weekly Workflow
Run this on a weekly chart. Daily checks add noise without improving the regime read.
Keep the 1-year chart and the 90-day heatmap open. Mark each week as profit-dominant or loss-dominant.
Only add exposure after a clean reclaim of 1.0 with two or three sessions holding above it.
Trim when profit spikes repeat without price progress. Recycle on the next regain.
Into CPI, FOMC, and major macro events: expect noise around 1.0. Wait for the weekly close before drawing conclusions.
Review weekly. Persistence beats headlines.
Weekly on-chain analysis live now
Alpha Insider members get a weekly on-chain read that applies this framework to current cycle conditions, alongside Kairos timing windows and DCA target levels mapped for this cycle.
It shows whether holders spending coins are locking in more profits than losses, which helps you gauge whether the market is in profit-taking mode or capitulation mode.
Realised profit and realised loss are totals. Realised PnL Ratio compares them, so you can see which side is dominating.
SOPR shows the average profit or loss multiple on spent coins. Realised PnL Ratio shows the balance of total profits versus total losses.
Yes. Strong markets can sustain profit dominance for extended periods. The more useful read is when dominance begins to roll over alongside other distribution signals.
Use realised price bands or realised cap for cost basis context, SOPR for spend behaviour, and exchange netflows for whether selling is hitting venues.
Weekly is usually enough for most readers. Daily checks can overreact to bursts caused by news or liquidation events.
This guide covers the educational framework. Applying it to live cycle conditions, with Kairos timing and mapped DCA levels, is what Alpha Insider membership provides each week.
This content is for education only and does not constitute financial advice. Crypto assets are volatile and you can lose money. Always do your own research and consider your risk tolerance before making any investment decisions.
On-chain and alt-sector research at The Markets Unplugged. Creator of the Bitcoin Barometer, Ethereum Barometer, Alt Sector Radar and ETH Rotation Index.
Host of the Crypto Unplugged podcast.
Co-founder and lead technical analyst at The Markets Unplugged. Leads technical,
macro, and cycle analysis, and builds the timing and macro frameworks behind TMU's
premium research. Instructor on the Cycle Intelligence course.
Co-founder and lead technical analyst at The Markets Unplugged. Leads technical,
macro, and cycle analysis, and builds the timing and macro frameworks behind TMU's
premium research. Instructor on the Cycle Intelligence course.
Co-founder and lead technical analyst at The Markets Unplugged. Leads technical,
macro, and cycle analysis, and builds the timing and macro frameworks behind TMU's
premium research. Instructor on the Cycle Intelligence course.
Co-founder and lead technical analyst at The Markets Unplugged. Leads technical,
macro, and cycle analysis, and builds the timing and macro frameworks behind TMU's
premium research. Instructor on the Cycle Intelligence course.
Co-founder and lead technical analyst at The Markets Unplugged. Leads technical,
macro, and cycle analysis, and builds the timing and macro frameworks behind TMU's
premium research. Instructor on the Cycle Intelligence course.
Co-founder and lead technical analyst at The Markets Unplugged. Leads technical,
macro, and cycle analysis, and builds the timing and macro frameworks behind TMU's
premium research. Instructor on the Cycle Intelligence course.
Co-founder and lead technical analyst at The Markets Unplugged. Leads technical,
macro, and cycle analysis, and builds the timing and macro frameworks behind TMU's
premium research. Instructor on the Cycle Intelligence course.
Co-founder and lead technical analyst at The Markets Unplugged. Leads technical,
macro, and cycle analysis, and builds the timing and macro frameworks behind TMU's
premium research. Instructor on the Cycle Intelligence course.
Co-founder and lead technical analyst at The Markets Unplugged. Leads technical,
macro, and cycle analysis, and builds the timing and macro frameworks behind TMU's
premium research. Instructor on the Cycle Intelligence course.
Co-founder and lead technical analyst at The Markets Unplugged. Leads technical,
macro, and cycle analysis, and builds the timing and macro frameworks behind TMU's
premium research. Instructor on the Cycle Intelligence course.
Co-founder and lead technical analyst at The Markets Unplugged. Leads technical,
macro, and cycle analysis, and builds the timing and macro frameworks behind TMU's
premium research. Instructor on the Cycle Intelligence course.
Co-founder and lead technical analyst at The Markets Unplugged. Leads technical,
macro, and cycle analysis, and builds the timing and macro frameworks behind TMU's
premium research. Instructor on the Cycle Intelligence course.
Co-founder and lead technical analyst at The Markets Unplugged. Leads technical,
macro, and cycle analysis, and builds the timing and macro frameworks behind TMU's
premium research. Instructor on the Cycle Intelligence course.
Co-founder and lead technical analyst at The Markets Unplugged. Leads technical,
macro, and cycle analysis, and builds the timing and macro frameworks behind TMU's
premium research. Instructor on the Cycle Intelligence course.
Co-founder and lead technical analyst at The Markets Unplugged. Leads technical,
macro, and cycle analysis, and builds the timing and macro frameworks behind TMU's
premium research. Instructor on the Cycle Intelligence course.
Co-founder and lead technical analyst at The Markets Unplugged. Leads technical,
macro, and cycle analysis, and builds the timing and macro frameworks behind TMU's
premium research. Instructor on the Cycle Intelligence course.
Co-founder and lead technical analyst at The Markets Unplugged. Leads technical,
macro, and cycle analysis, and builds the timing and macro frameworks behind TMU's
premium research. Instructor on the Cycle Intelligence course.
Co-founder and lead technical analyst at The Markets Unplugged. Leads technical,
macro, and cycle analysis, and builds the timing and macro frameworks behind TMU's
premium research. Instructor on the Cycle Intelligence course.
Co-founder and lead technical analyst at The Markets Unplugged. Leads technical,
macro, and cycle analysis, and builds the timing and macro frameworks behind TMU's
premium research. Instructor on the Cycle Intelligence course.
Co-founder and lead technical analyst at The Markets Unplugged. Leads technical,
macro, and cycle analysis, and builds the timing and macro frameworks behind TMU's
premium research. Instructor on the Cycle Intelligence course.






Discussion