


KAIROS got a significant update this week. Active cycle low windows now come with a drop zone, answering a question members have been asking since launch.
The timing question was always answered. When a window opens, members know a cycle low is potentially forming. The depth question was not. How far might price drop before the actual low prints? The drop zone answers that.
What the Drop Zone Shows
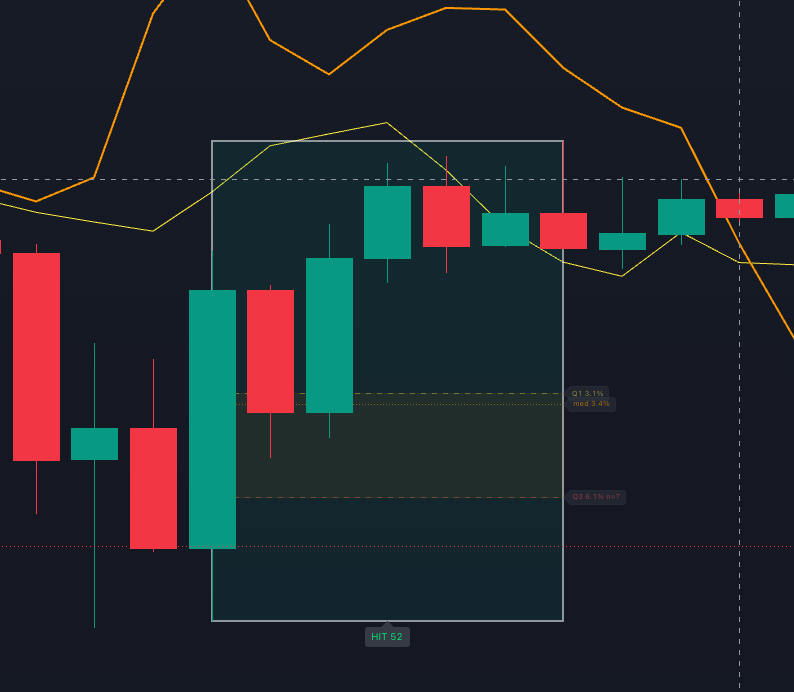
Three lines appear below the window's opening price when a LOW window is active.
The yellow line marks the shallow end. One in four historical windows produced a drop smaller than this. The orange line marks the typical depth, the best single estimate of where the low tends to print. The red line marks the deep end. One in four windows dropped further than this. The shaded box between the yellow and red lines contains the middle 50% of all historical outcomes.
How It Is Calculated
The zone computes live from the indicator's own archived windows on whatever chart you are looking at. BTC weekly uses BTC weekly history. No preset numbers, no hardcoded profiles.
The calculation filters to match the current window's tier and market context. When the matched sample is under 3 prior instances, the indicator broadens to all-context history for that tier and flags the zone with an asterisk. Small samples are labeled clearly. The zone is wide when history is thin and tighter as more windows archive over time.
How to Read It
A window opens at $77,000. Yellow line at $70,840, orange line at $66,220, red line at $60,060. A shallow pullback stays above the yellow line. A typical low lands near the orange line. Dropping past the red line would be an unusually deep outcome based on historical precedent.
The zone is not a prediction. It shows the range derived from what happened in the same tier and context combination historically.
Historical Zones for Verification
A second toggle adds drop zones to every archived window on the chart. Each historical zone shows what would have been visible to a member at that window's open bar, computed using only windows that had archived before it. No lookahead bias.
Roughly half of historical pivots should land inside the Q1 to Q3 zone by definition.
Why It Matters
KAIROS told members when to watch for a cycle low. The drop zone now adds how deep. Together they give a complete picture of the cycle low zone rather than timing alone.
Not financial advice. Always do your own research.


Discussion