


Key Points
- Reserve Risk is a Bitcoin on-chain indicator that compares price to long-term holder confidence.
- It is calculated as Bitcoin price divided by HODL Bank.
- HODL Bank represents the accumulated opportunity cost of holding… it tends to rise when older coins are not being spent and falls when older coins move.
- Reserve Risk is most useful for cycle context, because extreme zones have historically lined up with very different risk-reward backdrops.
- Treat it as context and confirmation, not as a single metric that “predicts” price.
- This guide is part of the Bitcoin on-chain series. For the full library of indicators and explainers, see the Bitcoin on-chain indicators hub.
- If any terms feel unfamiliar, use the Crypto Glossary, then return here.
Quick Answer
Reserve Risk measures how expensive Bitcoin is relative to long-term holder conviction. Low Reserve Risk suggests price is low compared with the confidence implied by HODL Bank, which has often aligned with late-bear and early-bull conditions. High Reserve Risk suggests price is high relative to holder confidence, which can align with late-cycle risk when other behaviour indicators also point to distribution. Use it as a regime filter, then confirm with spending, cost basis, and flow indicators.
What Are Reserve Risk and HODL Bank?
Reserve Risk gauges the balance between price and the confidence of long-term holders. It is defined as the current Bitcoin price divided by HODL Bank.
HODL Bank is a running measure of the opportunity cost of holding that builds when holders sit tight and falls when older coins are spent in size. When coin-day destruction is low, HODL Bank tends to rise. When old coins move at higher prices, HODL Bank tends to decline.
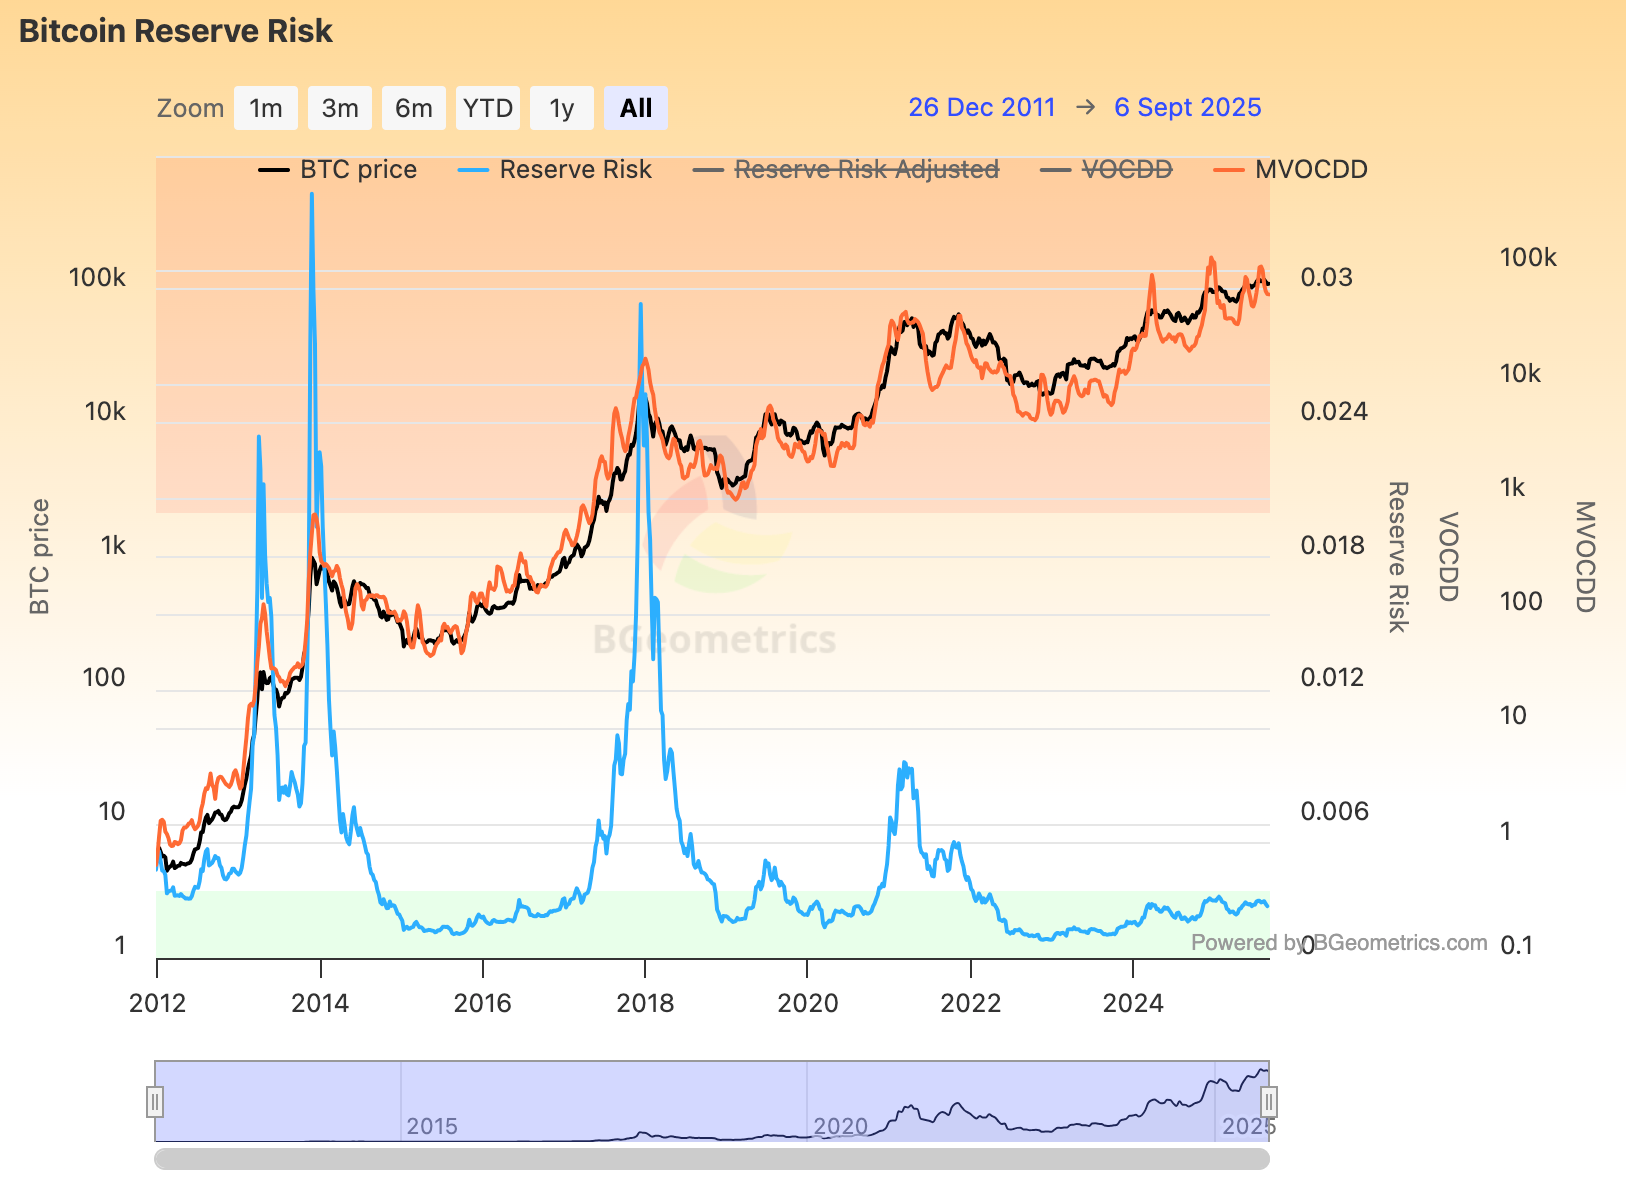
This chart places price in context with long-term holder confidence and highlights historically favourable and risky zones.
How Reserve Risk Behaves
- Rising price pushes Reserve Risk higher.
- Rising HODL Bank pushes Reserve Risk lower by adding weight to the denominator.
- Sideways price while HODL Bank climbs can pull Reserve Risk down into favourable territory.
- Elevated price and falling HODL Bank can push Reserve Risk into riskier territory.
Why It Matters
- It frames risk versus reward through a holder-confidence lens rather than only price.
- It helps separate late-bear accumulation windows from late-cycle risk.
- It captures the effect of halvings and changing miner issuance indirectly through holder behaviour.
Interpreting Zones
Treat zones as guides. Use historical percentiles rather than fixed numbers.
- Depressed Reserve Risk often aligns with late-bear to early-bull phases where patient capital dominates.
- Mid-range Reserve Risk is compatible with constructive advances if other indicators agree.
- Elevated Reserve Risk has coincided with late-cycle conditions where distribution risk rises.
Practical Reads

- Duration matters more than single prints. Sustained time in favourable zones carries more information than a quick dip.
- Look for falling Reserve Risk during consolidations. That often reflects growing holder confidence beneath price.
- Be cautious when Reserve Risk rises quickly while other behaviour metrics show distribution.
Use With Confluence
Pair Reserve Risk with:
- Liveliness or CDD to confirm whether old coins are actually moving.
- SOPR and Realised Profit/Loss to see if profit taking is being absorbed or not.
- Realised Price bands to check if price has firm cost-basis support when Reserve Risk is low.
- Exchange netflows to validate whether supply pressure is increasing.
Common Pitfalls
- Treating any single zone as a trigger without support from behaviour and flow data.
- Ignoring that bands migrate as liquidity and market participation evolve.
- Reading Reserve Risk without checking whether HODL Bank is rising or falling.
A Simple Workflow You Can Reuse
- Open Reserve Risk (weekly) and note the zone and direction.
- Check Liveliness or CDD to see whether old coins are moving.
- Cross-check aSOPR and Realised PnL for behaviour.
- Compare price with Market, LTH, and STH Realised Price for valuation support.
- Decide: improving confidence with support, or elevated risk with signs of distribution.
Mini FAQs
Is low Reserve Risk automatically bullish?
Not by itself. It improves the risk-reward backdrop, then you look for confirmation from holder behaviour, cost basis, and flows.
Why can Reserve Risk stay low for months?
If HODL Bank keeps rising while price is range-bound, confidence builds in the background and the denominator stays heavy.
Does a spike in Reserve Risk mean a top is in?
A spike is not enough on its own. Treat it as a warning that needs confirmation from profit taking and flow data.
What timeframe is best for Reserve Risk reads?
Weekly is usually enough for most readers. Daily moves can be noisy and often do not change the regime read.
What should be used for confirmation?
Cross check Liveliness or Coin Days Destroyed, then compare with SOPR or realised profit and loss, realised price bands, and exchange netflows to see whether distribution pressure is actually rising.
If this helped you read holder confidence versus price, Alpha Insider members can access deeper Bitcoin on-chain analysis and commentary here.
Alpha Insider members get:
➡️ Kairos timing windows to plan entries before the crowd moves
➡️ A full DCA Targets page with levels mapped for this cycle
➡️ Exclusive member videos breaking down charts in clear, simple terms
➡️ A private Telegram community where conviction is shared daily
Built for clearer decisions, week after week.
Legal And Risk Notice
This content is for education only and does not constitute financial advice. Crypto assets are volatile and you can lose money. Always do your own research and consider your risk tolerance.


Discussion