


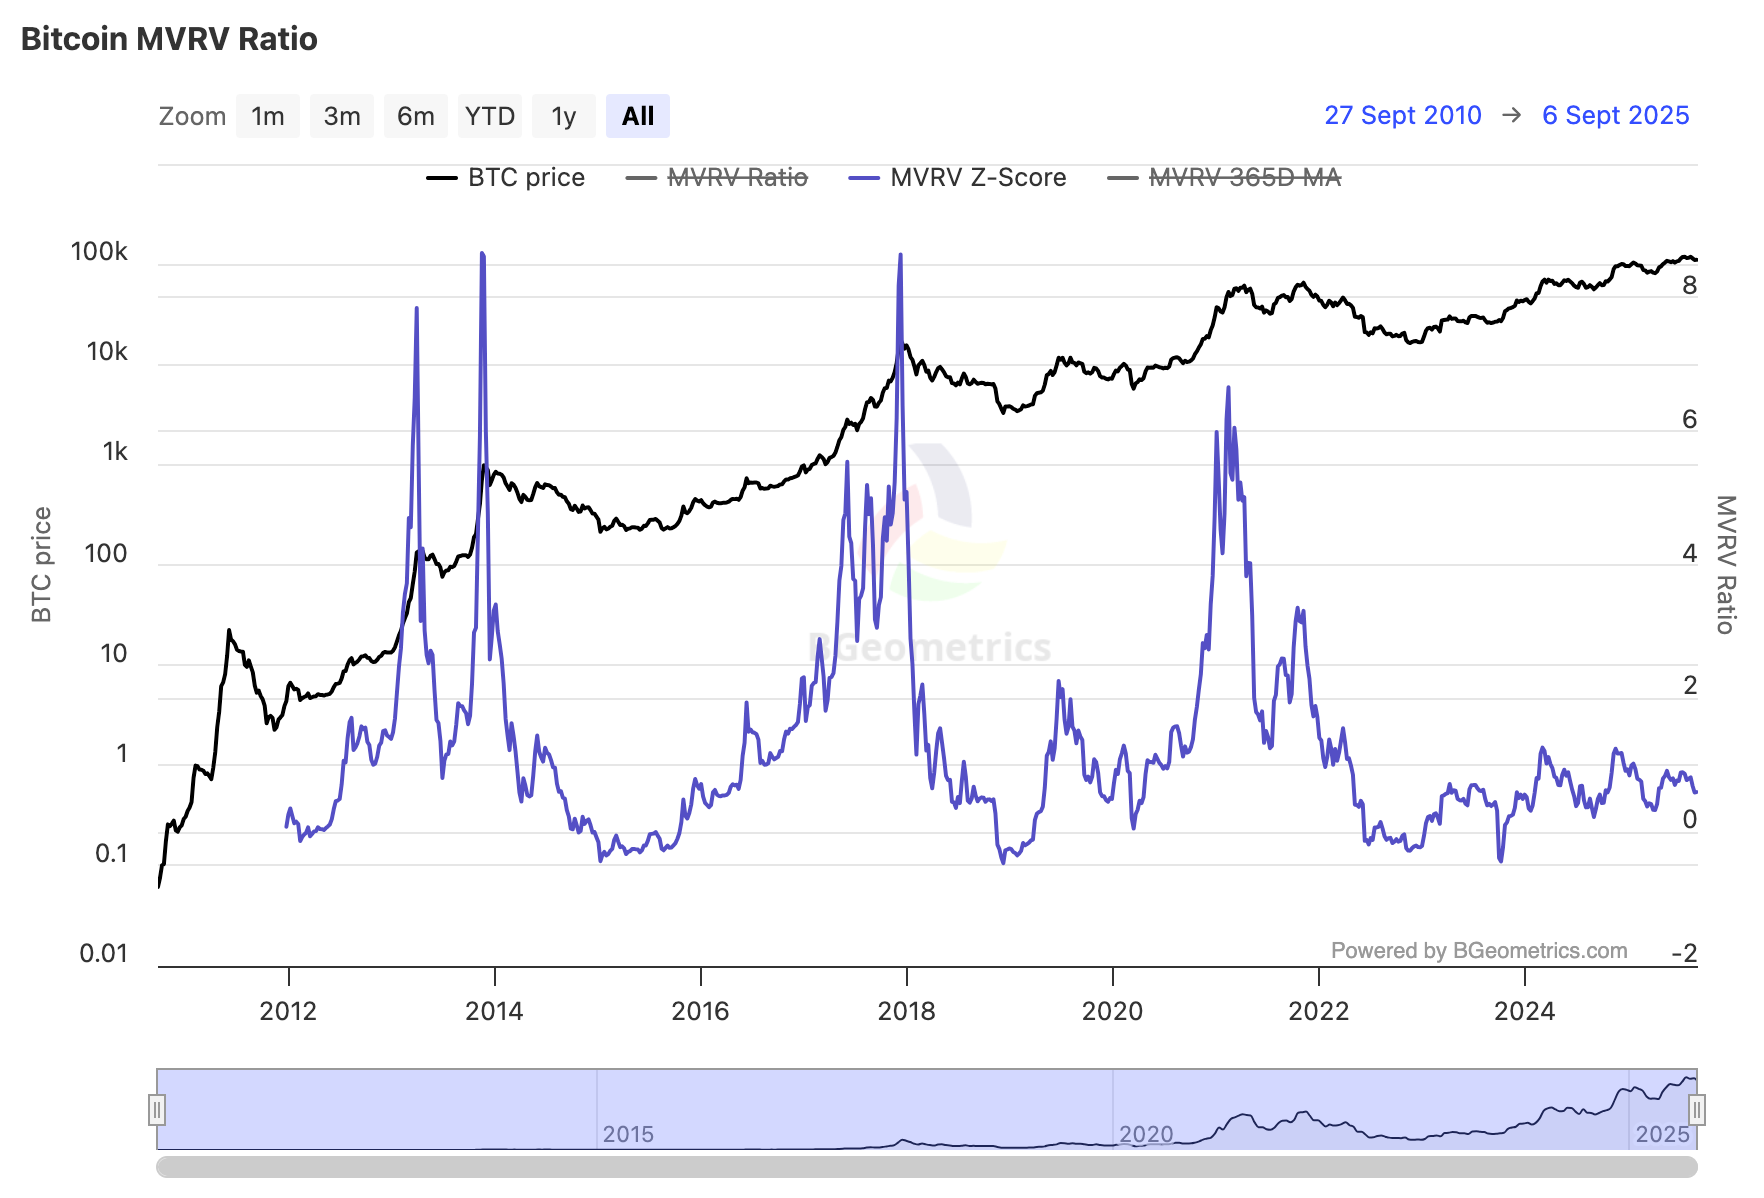
MVRV Z-Score measures how far Bitcoin market value sits above or below realised value after scaling the gap against historical variability. Higher readings suggest valuation is statistically stretched versus on-chain cost basis, while lower readings suggest Bitcoin is closer to depressed or reset conditions. It is a cycle context tool, not a standalone timing trigger.
What Is The MVRV Z-Score?
MVRV Z-Score is a normalised Bitcoin valuation metric. It compares market value with realised value, then scales the gap using the historical variability of market value.
The result is a statistical valuation lens. It helps show whether Bitcoin is trading unusually far above its on-chain cost basis, close to it, or below zones that have historically aligned with reset conditions.
How Is MVRV Z-Score Calculated?
The calculation starts with the same foundation as MVRV: market value and realised value. Market value is the current market capitalisation. Realised value prices each coin at the price when it last moved on-chain, then sums those values.
MVRV Z-Score then takes the gap between market value and realised value, and scales it by the historical standard deviation of market value.
That scaling matters. It allows analysts to compare stretched or depressed valuation zones across different cycles, instead of relying only on a raw ratio.
How To Interpret The Risk Bands
MVRV Z-Score bands are not hard rules. They are broad valuation zones that help frame the level of cycle pressure.
| Z-Score Area | Typical Read | How To Use It |
|---|---|---|
| Below 0 | Depressed valuation | Market value is close to or below realised value. Look for confirmation from holder behaviour and flows. |
| 0 to 2 | Constructive or reset area | Often appears during recovery or steady advance phases. Confirmation still matters. |
| 2 to 4 | Expansion zone | Valuation premium is building, but not necessarily overheated. |
| 4 to 6 | Elevated pressure | Risk rises if profit-taking, distribution, or weaker flows also appear. |
| Above 7 | Late-cycle pressure | Historically associated with stronger overheating risk when other tools confirm distribution. |
Why Use Z-Score Instead Of MVRV Ratio Alone?
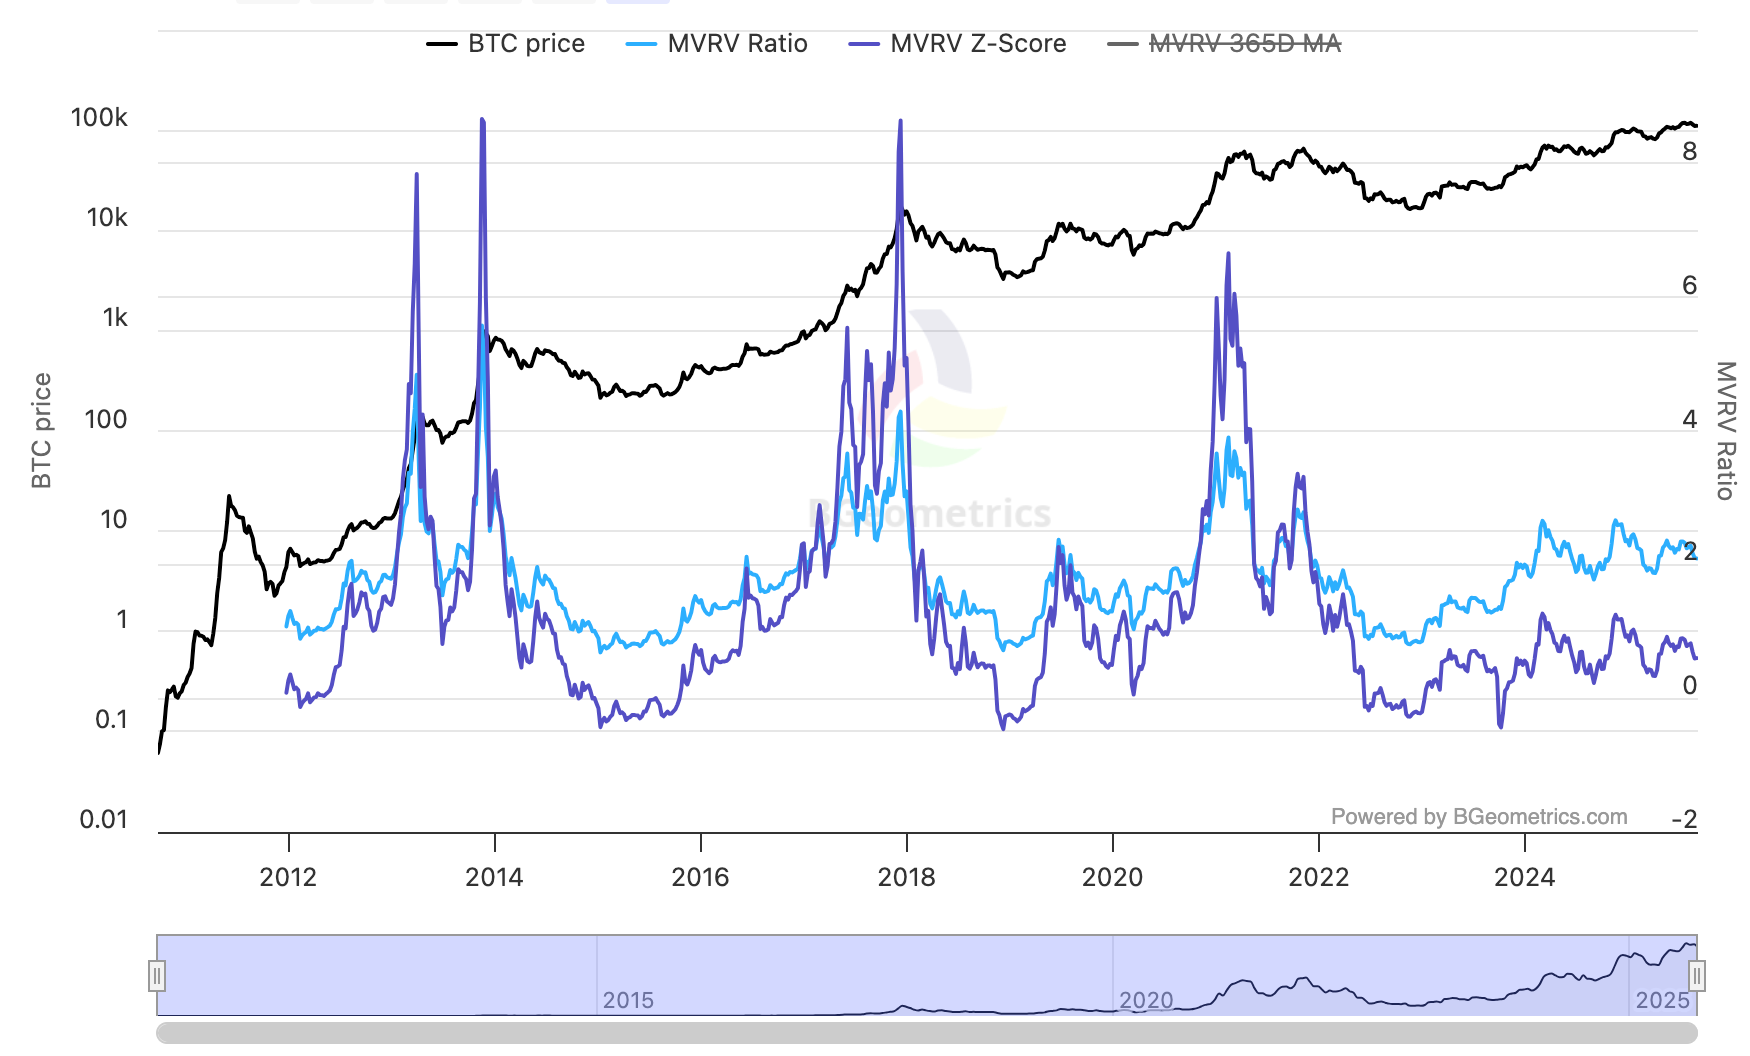
MVRV Ratio shows the relationship between market value and realised value. MVRV Z-Score takes that relationship and adjusts it for historical variability.
That makes the Z-Score useful when comparing different cycle environments. A raw MVRV ratio can feel different across liquidity regimes, while Z-Score helps frame whether the premium is statistically unusual against its own history.
This does not make Z-Score better in every situation. It gives a different layer. MVRV Ratio is cleaner and more intuitive. MVRV Z-Score is better for judging statistical stretch and cycle extremes.
Practical Use Cases
Cycle Context
Use weekly MVRV Z-Score to frame where Bitcoin sits relative to realised value in a statistical sense. Rising Z within mid-bands can support expansion, while fading high-band readings deserve more caution.
Divergences
If price pushes higher while Z-Score fails to confirm, valuation pressure may be weakening. If price is flat while Z-Score improves from a low area, value may be rebuilding beneath the surface.
Confluence With Other Valuation Tools
Pair Z-Score with MVRV Ratio, Realised Price Bands, SOPR, Realised PnL Ratio, and spending-age tools. The best reads come when valuation, profit-taking, holder behaviour, and flows point in the same direction.
A Weekly Workflow You Can Reuse
- Open MVRV Z-Score on a weekly chart.
- Mark the current band and the direction of travel.
- Check whether the raw MVRV Ratio agrees with the Z-Score read.
- Compare against realised price bands to frame cost-basis pressure.
- Check SOPR or realised profit and loss for spending behaviour.
- Use exchange flows and spending-age indicators to confirm whether distribution pressure is actually present.
Do not read MVRV Z-Score alone. It can remain elevated during strong advances and depressed during weak markets. The useful read comes from how it behaves beside cost basis, spending, and flows.
MVRV Z-Score feeds the Valuation score inside the Bitcoin Barometer. See where valuation sits in the current cycle.
See the Bitcoin Barometer →Mini FAQs
This content is for education only and does not constitute financial advice. Crypto assets are volatile and you can lose money. Always do your own research and consider your risk tolerance before making any investment decisions.


Discussion