


This guide explains how long-term and short-term holders behave differently, and how to use three simple charts to judge where risk sits.
Key Points
- Long-Term Holders (LTH) and Short-Term Holders (STH) are split by a 155-day holding threshold, because spending probability changes sharply after that point.
- “Risk” usually sits with the cohort that is most reactive to price, and that is often the short-term cohort when it is heavily in profit.
- STH realised price (cost basis) is a practical pivot, it tells you whether recent buyers are mostly in profit or under pressure.
- Supply split matters because rising LTH supply often means tighter float, while rising STH supply often means a more reactive market.
- Profitability by cohort helps you judge whether selling pressure is likely to be profit-taking or capitulation.
- This guide is part of the Bitcoin On-Chain Indicators hub.
- If you want quick definitions for terms used here, see the Crypto Glossary.
Quick Answer
Long-Term Holders are coins that have not moved for more than 155 days, Short-Term Holders are coins that moved within the last 155 days. The split matters because newer coins are statistically more likely to be spent, which means STH supply and STH profitability often drive the next wave of volatility. The clean beginner approach is to combine three reads, STH realised price (recent buyer cost basis), the LTH vs STH supply split (who holds the float), and the percentage of each cohort in profit (who can sell into strength).
What Long-Term And Short-Term Holders Mean
The network does not label “investors”, it only records when coins last moved.
Analytics providers use that behaviour to create cohort groups:
- Short-Term Holders (STH)
Coins last moved within the last 155 days. These coins are more likely to be spent again, so this cohort often reacts first. - Long-Term Holders (LTH)
Coins last moved more than 155 days ago. These coins are statistically less likely to be spent, so this cohort tends to sell later, and more selectively.
A beginner-friendly way to think about it:
- STH are the most recent buyers, most sensitive to swings, and most likely to panic sell or take quick profit.
- LTH are the slower cohort, less sensitive to daily moves, and more likely to distribute gradually into major strength, if and when they do.
Why The Split Helps You Find “Who Carries The Risk”
“Risk” is not a moral label. It is a practical question.
- Who is most likely to sell soon
- Who is sitting on the most unrealised profit
- Who holds the most supply that could hit the market
In many phases, the answer is the short-term cohort, because they are the marginal participant.
Two simple questions frame a lot of on-chain reads:
- Who holds more supply right now, LTH or STH
- Which cohort is mostly in profit right now
If STH hold a small share but are heavily in profit, they can still drive sharp pullbacks, because they are the most reactive sellers. If LTH supply is high and still rising, that usually means supply is ageing and staying put, which often makes the market more resilient during dips.
Chart 1: STH Realised Price As The Cost Basis Pivot
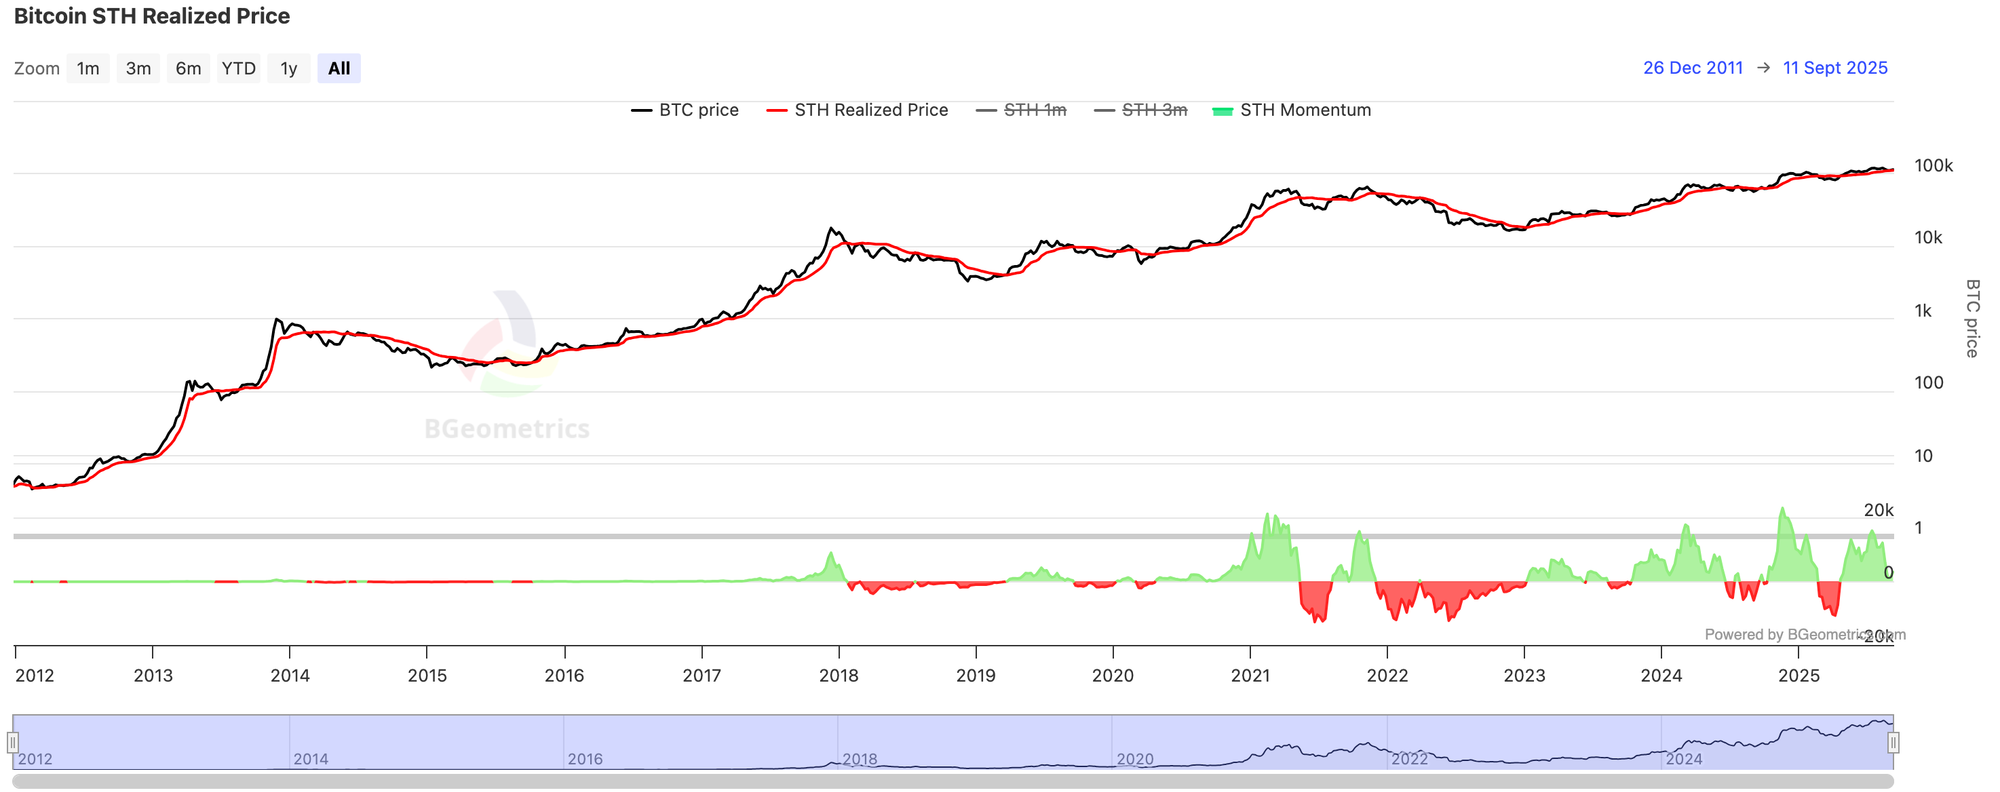
This chart overlays spot price with the average on-chain cost basis for short-term holders. When spot is above STH realised price, recent buyers are broadly in profit, when spot is below, recent buyers are under pressure.
Here is how to use it without overcomplicating things.
- Spot Above STH Realised Price
Recent buyers are broadly in profit. This does not automatically mean “sell”, it means the market has more profit available to be taken quickly, which can increase sensitivity to any negative catalyst. - Spot Near STH Realised Price
This is often the “decision zone”. Small moves can flip recent buyers from profit to loss and back again. In these zones, markets often chop, because recent buyers are not comfortable enough to hold, but not stressed enough to fully capitulate either. - Spot Below STH Realised Price
Recent buyers are broadly under water. That often means forced selling has already happened, and marginal sellers are fewer. It can still go lower, but the market frequently becomes less “crowded” because weak hands have already been flushed.
Beginner mistake to avoid: treating STH realised price like a magical support line. It is a context level, not a guarantee. The value comes from understanding which cohort is comfortable, and which cohort is stressed.
Chart 2: Supply Split Between LTH And STH
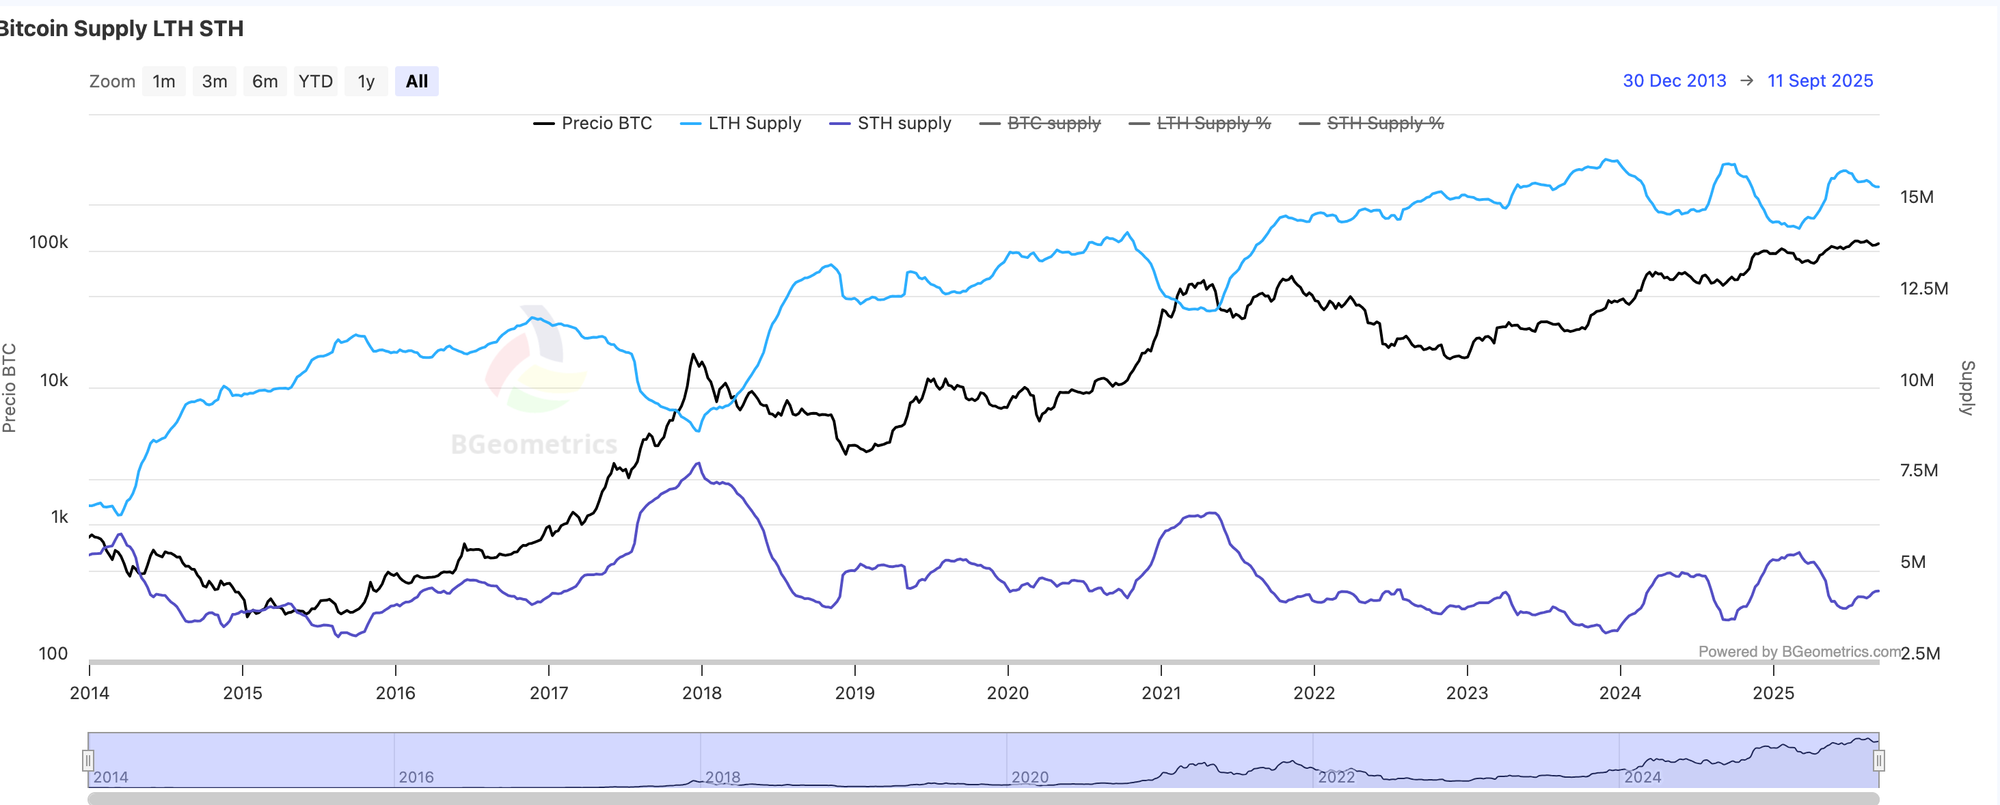
This chart shows the amount of supply held by long-term holders and short-term holders. Rising LTH supply typically means coins are ageing and staying put, rising STH supply often means more supply is held by recent buyers.
This chart answers a simple question: who holds the float.
- Rising LTH Supply, Falling STH Supply
Supply is ageing and moving into the long-term bucket. This often coincides with tighter float, because fewer coins are sitting with the most reactive cohort. - Rising STH Supply
More supply is held by recent buyers. This often increases reactivity, because recent buyers tend to sell into fear and sell into profit more quickly. - Falling LTH Supply
This is the one to respect when it persists. LTH supply can fall quickly because once a long-held coin moves, it instantly becomes “short-term” again. When LTH supply declines for weeks, it can be a sign that older holders are distributing.
Beginner mistake to avoid: confusing “STH supply falling” with “selling”. STH supply can fall simply because coins are ageing past 155 days into LTH. That is not distribution, it is maturation.
Chart 3: Profitability By Cohort
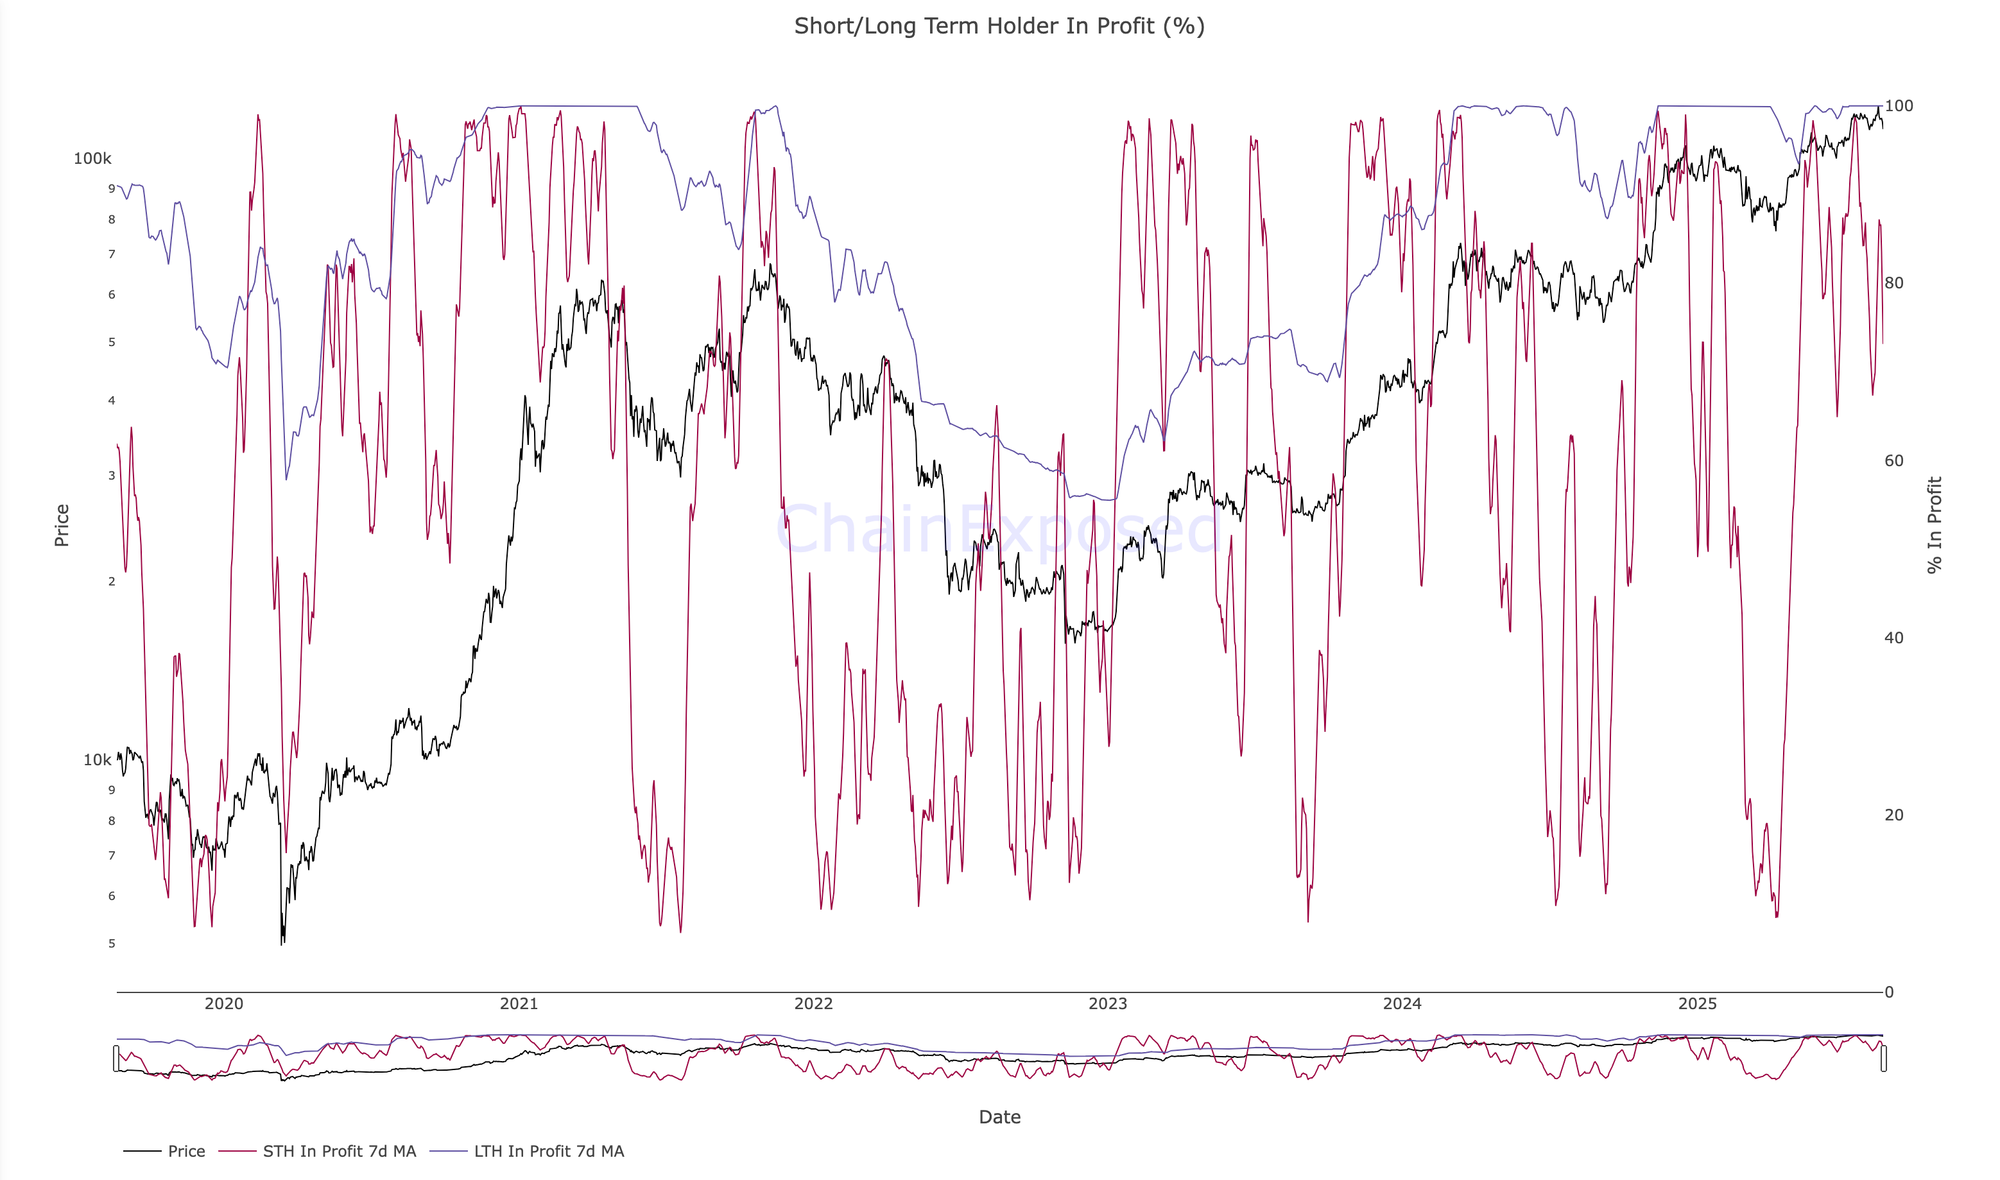
This chart shows what percentage of each cohort’s supply is in profit versus its cost basis. High STH profit often means higher sensitivity to profit-taking, while LTH profit tends to stay high for long stretches and becomes meaningful mainly when LTH supply starts to fall.
This chart is a sanity layer for the story you are telling yourself.
- STH Profit Very High
Many recent buyers are sitting on unrealised gains. That often increases the chance of quick profit-taking on rallies, especially if price momentum slows. - STH Profit Very Low
Many recent buyers are under water. That often means stress has already passed through the reactive cohort, which can reduce marginal sell pressure. - LTH Profit High
This is normal in a bull market. It does not become “danger” on its own. It becomes meaningful when LTH supply starts falling, because that signals older holders are actually spending.
How To Read All Three Together
This is where the signal becomes cleaner.
Scenario 1: Lower Risk, Tightening Float
- LTH supply is rising or stable
- STH supply is flat or falling
- Spot is near or below STH realised price, or only modestly above it
- STH profit is not extreme
Interpretation: the reactive cohort is not sitting on huge profits, and supply is ageing. The market can still pull back, but the “who sells next” risk is usually lower.
Scenario 2: Higher Risk From Recent Buyers
- STH supply is rising
- Spot is comfortably above STH realised price
- STH profit is elevated
Interpretation: more coins are sitting with the reactive cohort, and they are in profit. That often increases the chance of sharp pullbacks driven by profit-taking, especially if momentum stalls.
Scenario 3: Late-Phase Distribution Watch
- LTH supply starts falling for multiple weeks
- STH supply rises at the same time
- LTH profit remains high
Interpretation: older coins are being spent and reclassed into short-term hands. This is not an instant top signal, but it is a regime change worth respecting, because the cohort that rarely sells is now becoming active.
Scenario 4: Stress Reset
- Spot below STH realised price
- STH profit depressed
- STH supply elevated, but starts falling as coins are sold or age out
- LTH supply begins stabilising or rising later
Interpretation: recent buyers are stressed, some capitulation may be occurring. These phases often set up the next recovery, but timing is never perfect, focus on persistence and confirmation.
Where Beginners Usually Get Tripped Up
Cohort data is slow-moving and can be distorted by cohort migration. Focus on multi-week trends and use more than one chart.
- Overreacting to one week
These are slow series. Weekly clusters matter more than single prints. - Ignoring cohort migration
Coins “become” LTH simply by not moving for 155 days. A rise in LTH supply can be simple maturation, not fresh demand. - Treating LTH profit as an automatic sell signal
LTH profit can stay high for long periods. The more meaningful change is LTH supply falling, because that means older holders are actually spending. - Forgetting that cost basis is a distribution of buyers
STH realised price is an average. Some buyers are far above it, some far below. Use it as context, not as certainty.
What To Add If You Want A Cleaner Confirmation Layer
If you are ready to go one step deeper, add one flow dial and one acceptance dial:
- Flow dial: exchange netflows or exchange reserves
This helps confirm whether coins are moving toward venues (potential sell pressure) or leaving venues (potential tightening float). - Acceptance dial: SOPR or Realised PnL Ratio
This helps confirm whether realised selling is being absorbed or whether losses are dominating.
You do not need ten indicators. You need a small stack that answers, who holds supply, who is in profit, and whether selling is being accepted.
Simple Weekly Workflow You Can Reuse
- Step 1: Supply Context
Open the LTH vs STH supply chart and note which cohort is dominant and the 4 to 8 week direction. - Step 2: Cost Basis Context
Compare spot to STH realised price, note whether spot is above, near, or below. - Step 3: Profitability Context
Check STH in profit and LTH in profit, note whether STH profitability looks stretched or depressed. - Step 4: Write One Sentence
“Risk sits mainly with STH” or “risk sits mainly with LTH” and state why, based on the three reads. - Step 5: Only Act On Persistence
If the same message repeats for two to three weeks, treat it as meaningful. If it flips every week, do not force a conclusion.
Mini FAQs
Is The 155-Day Split Arbitrary?
No. It is a behavioural threshold used by major on-chain providers because spending probability changes meaningfully around that point.
Does High LTH Supply Guarantee Higher Prices?
No. It signals tighter float, not direction. Price still depends on demand and broader risk conditions.
Is STH Realised Price A Buy Or Sell Line?
No. It is a context level. Above it means recent buyers are broadly in profit, below it means recent buyers are broadly under pressure.
What Is The Cleanest “Rising Risk” Mix?
STH supply rising, STH profitability high, spot well above STH realised price, plus any sustained fall in LTH supply.
How Often Should This Be Checked?
Weekly is enough for most people. Daily checking often adds confusion without improving decisions.
If this helped you with on-chain data, join Alpha Insider for weekly timing windows, dashboards, and member videos. Fewer mistakes… cleaner execution… more conviction.
Alpha Insider members get:
➡️ Kairos timing windows to plan entries before the crowd moves
➡️ A full DCA Targets page with levels mapped for this cycle
➡️ Exclusive member videos breaking down charts in clear terms
➡️ A private Telegram community where conviction is shared daily
This isn’t noise… it’s the full playbook.
Legal & Risk Notice
This guide is for education only, not financial, investment, legal, accounting, or tax advice. Nothing here is a recommendation to buy, sell, or use any product or service. Cryptoassets are high risk and prices can go to zero. Only use amounts you can afford to lose. Availability and legality vary by country, check your local rules before acting. You are responsible for your own decisions.


Discussion