


Key Points
- SLOOS tracks whether banks are tightening or easing lending standards, plus whether loan demand is rising or falling.
- Above zero means net tightening, below zero means net easing, persistence matters more than a single print.
- Small firms often feel tight credit first, which later feeds into earnings and broader risk appetite.
- Tightening standards plus weak demand is the harshest mix, easing standards plus improving demand is the friendliest mix.
- For more macro dials like this, use the Macro For Beginners hub.
- If you want quick definitions for terms like SLOOS, credit spreads, real yields, and DXY, see the Crypto Glossary.
Quick Answer
SLOOS (the Senior Loan Officer Opinion Survey) is a Federal Reserve survey that reports the net percentage of banks tightening or easing lending standards, plus the net change in loan demand. When SLOOS stays above zero, credit is tightening and the economy often slows later. When it stays below zero, credit is easing and conditions tend to improve. Use it as a quarterly regime dial, not a weekly trading signal.
SLOOS matters because bank credit is still the main fuel line for the real economy. Persistent tightening usually slows working capital and capex, then shows up later in earnings, spreads, and risk appetite. The cleanest read comes from combining lending standards with loan demand, then cross-checking credit spreads, DXY, and real yields.
What Is SLOOS And How Do You Read “Tighter”?
The Senior Loan Officer Opinion Survey tracks two core things:
- Standards: the net percentage of banks tightening or easing loan standards.
- Demand: the net change in demand for loans.
How To Read It:
- Above zero: more banks are tightening than easing.
- Below zero: more banks are easing than tightening.
- Main rule: direction and persistence beat any single print because credit cycles move in long waves.
SLOOS tends to spike around stress events and recessions. The bigger signal is not the spike, it is the prolonged period of tightening that curbs activity with a lag.
Small Firms Often Feel It First
Smaller borrowers depend more on bank credit and have weaker access to bond markets. That is why tightening to small firms can downshift risk appetite earlier in the real economy, which later bleeds into earnings and liquidity.
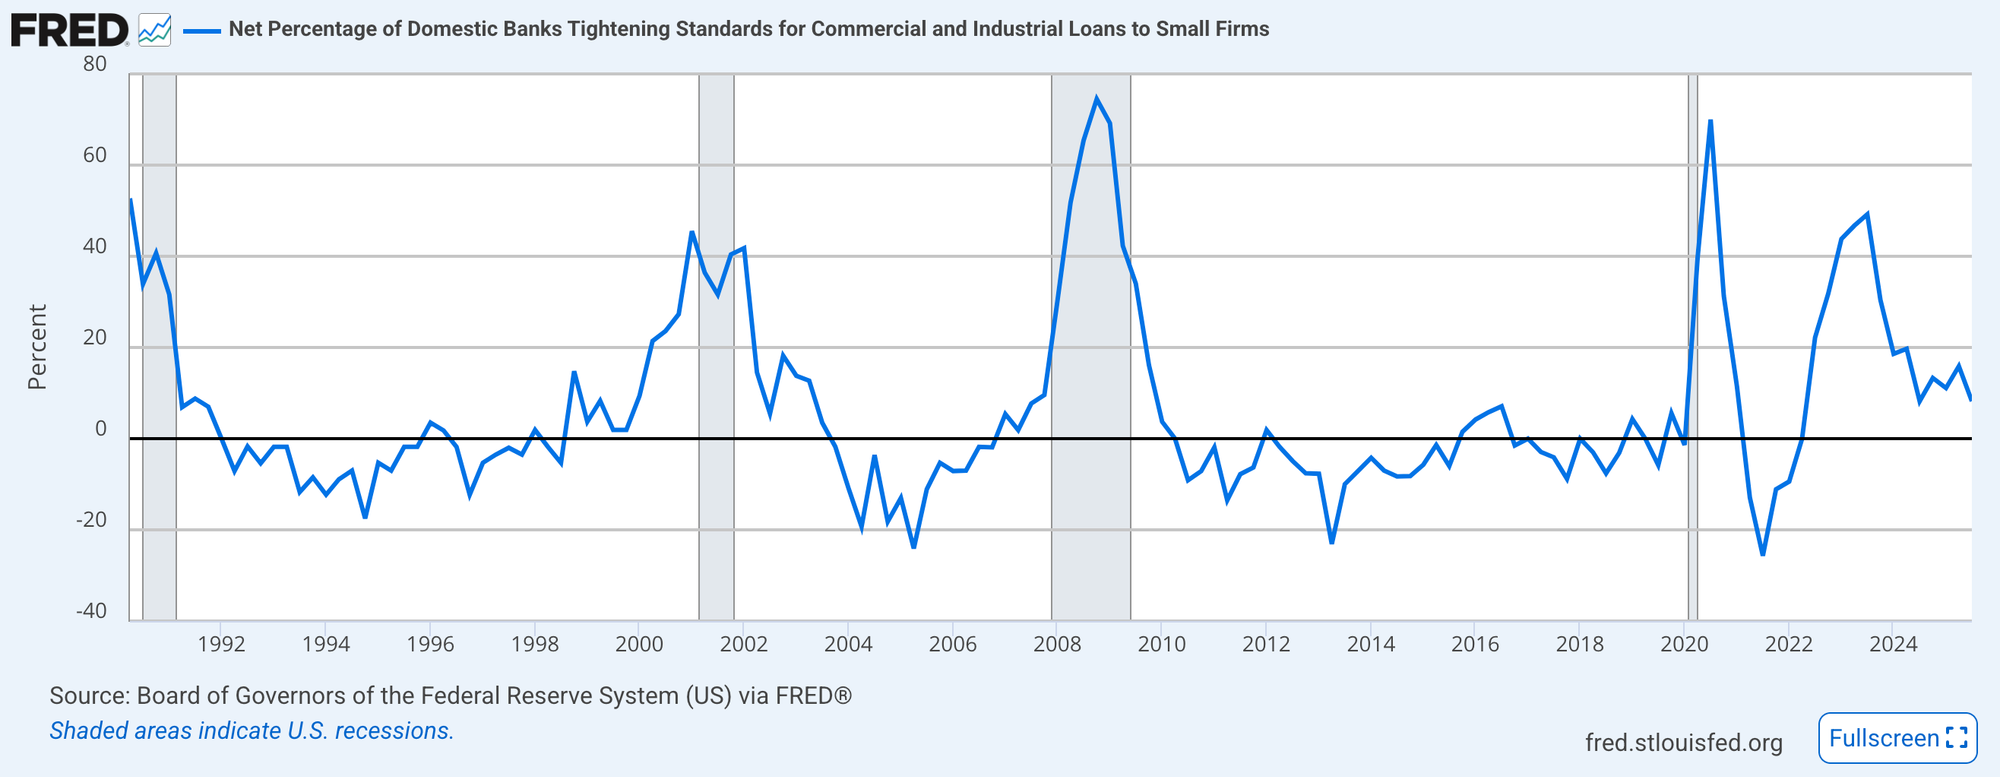
This chart helps you spot when credit becomes scarce for small firms. Extreme positives often mark tight availability that cools activity with a lag.
Demand Matters As Much As Supply
Standards measure the supply of credit. Demand tells you whether firms even want loans.
Two Common Regimes:
- Tightening plus soft demand: a double squeeze, slower activity is more likely.
- Easing plus firm demand: the friendliest backdrop, especially when spreads are narrowing.
Sustained negatives flag weaker appetite to borrow. When that sits alongside tighter standards, activity can slow even if rates fall a little.
Practical Thresholds
These are guide rails, not gospel, use them with trend and cross-checks.
- Standards above zero and rising for two or more quarters: tightening regime, expect wider spreads and pickier funding.
- Standards rolling over from high positives toward zero: early relief, wait for demand to stabilise before leaning into risk.
- Standards below zero with demand improving: easier tape for risk, especially if spreads narrow.
- Large and small firms both above zero while demand is below zero: macro headwind, respect the lag into earnings.
Why This Bites Risk Assets And Bitcoin
Tighter bank credit slows working capital and capex, profits wobble, default premia widen, and liquidity preference rises.
Even in liquid markets, crypto often feels the downstream effect through broader risk appetite and USD liquidity conditions. Rallies can still happen, but persistent tightening with weak demand raises the bar for sustained uptrends.
Pair SLOOS With These Cross-Checks
- Credit spreads: HY OAS and IG spreads, widening alongside tighter standards confirms risk degradation.
- Rates and FX: 10-year real yields and DXY, firmer real rates with tightening credit is a tougher mix.
- Small business pulse: NFIB hiring plans, weakness often reinforces the small-firm SLOOS message.
- Bank health: loan growth and charge-offs, slowing growth with rising charge-offs can extend the tightening phase.
Common Traps To Avoid
- Overreacting To One Print: one quarter can be noise, look for two or more consecutive quarters.
- Ignoring Demand: tight standards are not the full story if demand is rebounding.
- Forgetting The Lag: SLOOS leads, earnings and risk often react later, not instantly.
A Simple Workflow You Can Reuse
- Mark the regime each quarter, standards above or below zero for large and small firms.
- Overlay demand, is demand rising or falling at the same time.
- Cross-check markets, HY OAS, 10-year real yields, and DXY, look for alignment before changing your view.
- For Bitcoin context, conditions are usually friendlier when standards trend down with stabilising demand and tightening spreads, conditions are usually harsher when standards trend up and demand erodes.
- Review quarterly, persistence wins.
Mini FAQs
Is A Single Quarter Move Enough To Act On?
No. Look for two or more consecutive quarters and confirm with spreads or real yields.
Can Markets Rally While SLOOS Tightens?
Yes. Positioning and micro flows can override for weeks, but persistent tightening usually drags on earnings and liquidity later.
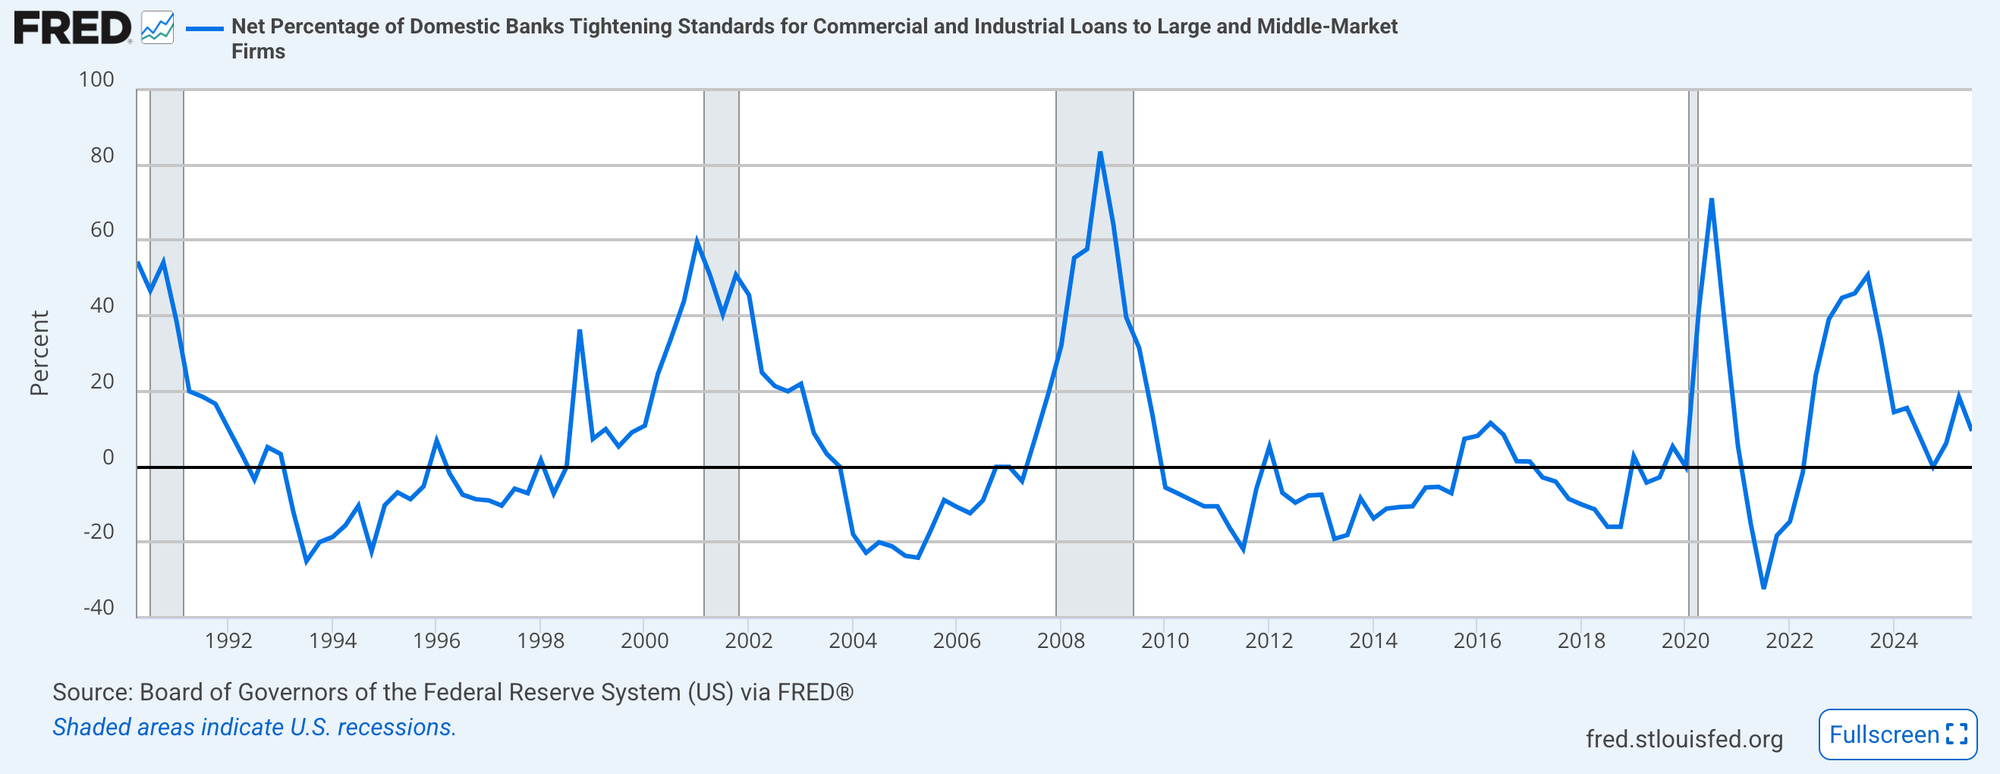
Which SLOOS Series Is Most Useful?
Start with C&I standards for large and middle-market firms and small firms, then layer C&I loan demand for large and middle-market firms.
If this helped you read tight versus loose without guesswork, join Alpha Insider for Macro Heat dashboards, calendar previews for the next prints, and a weekly positioning watchlist.
Alpha Insider members also get:
➡️ Kairos timing windows to plan entries before the crowd moves
➡️ A full DCA Targets page with levels mapped for this cycle
➡️ Exclusive member videos breaking down charts in plain English
➡️ A private Telegram community where conviction is shared daily
➡️ A dedicated Macro Analysis page with regularly updated analysis and monthly reports
Ready made playbook… use it.
Legal And Risk Notice
This content is for educational purposes only and is not financial advice. Markets are volatile and you can lose money. Do your own research and consider your risk tolerance before making financial decisions.


Discussion