


This guide is part of the Bitcoin on-chain series. For the full library of indicators and explainers, see the Bitcoin on-chain indicators hub.
If any terms feel unfamiliar, use the Crypto Glossary then return here.
Quick Answer
AHR999 is a Bitcoin valuation index that compares Bitcoin's price to its 200-day moving average and groups the relationship into three zones. Below 0.45 is historically a deep value zone. Between 0.45 and 1.20 is the core accumulation band where dollar-cost averaging tends to work cleanly. Above 1.20 is a hotter zone where risk and drawdown potential increase. Use it as a regime anchor to guide position sizing and expectations, not as a precise buy or sell trigger.
Key Points
- AHR999 turns Bitcoin's distance from the 200-day average into three valuation zones, making it easy to see deep value, core accumulation, and overheated conditions at a glance.
- Readings well below the lower band have historically aligned with value zones where staged buying has worked once downside momentum slows.
- The middle band maps a fixed-investment range where dollar-cost averaging and trend-following tend to behave cleanly.
- Extended time in the upper band signals a hotter tape where gains can continue but drawdown risk rises and pullbacks are sharper.
- AHR999 is most useful when paired with the 200-day trend and other on-chain indicators rather than used as a lone trigger.
What Is the AHR999 Index for Bitcoin?
AHR999 is a long-horizon valuation index built from Bitcoin's price relative to its 200-day moving average. Instead of giving you a single ratio to interpret in isolation, it groups that relationship into three zones that correspond to deep value conditions, a neutral fixed-investment band, and a hotter region near cycle extremes.
By compressing historical price behaviour into those bands, AHR999 gives you clear context about the current market regime: is Bitcoin cheaper than usual, broadly neutral, or pushing into territory where past cycles have run hot?
It is designed to guide position sizing and expectations over months, not to tell you the exact day to buy or sell.
The AHR999 Formula: How It Is Calculated
The AHR999 index is built from two components.
The first is Bitcoin's current market price. The second is the 200-day simple moving average of Bitcoin's price.
The core calculation divides the current price by the 200-day moving average and normalises this ratio across historical data. The resulting number positions today's price relative to Bitcoin's long-term trend in a way that is comparable across different points in the market cycle.
Expressed simply:
AHR999 = (Current Bitcoin Price / 200-Day Moving Average) normalised across historical range
When the result is well below 1, Bitcoin is trading significantly below its long-term trend, which has historically corresponded to undervalued or distressed conditions. When the result is near or above 1, Bitcoin is trading at or above its long-term trend, with higher readings indicating increasing departure from historical norms.
The three practical zones emerge from mapping where this ratio has sat historically during deep bear markets, neutral trending periods, and late-stage bull runs.
Where To Find the Current AHR999 Value
The live AHR999 reading for Bitcoin is available on two main platforms.
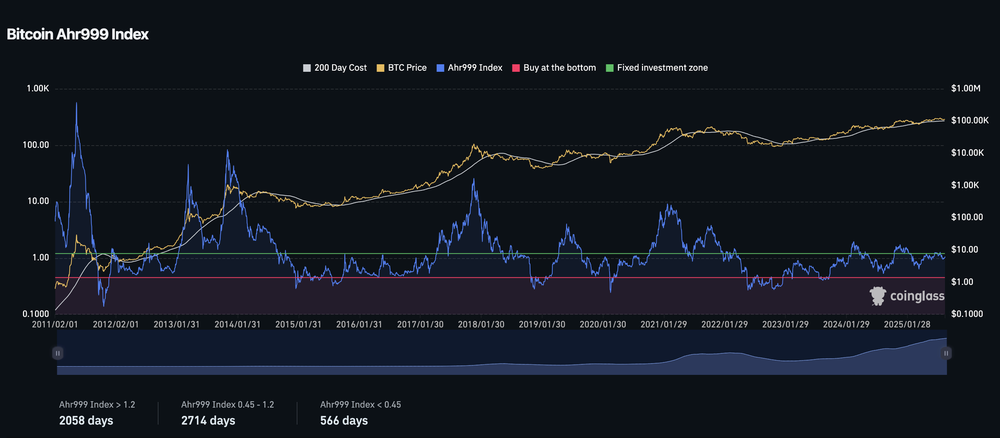
Coinglass (coinglass.com): Search for AHR999 in the indicators section. Coinglass displays the live reading alongside a historical chart showing the three bands.
Bitcoin Magazine Pro (bitcoinmagazinepro.com): Provides the AHR999 chart with additional context and commentary.
The current value tells you which zone Bitcoin is in right now. The chart history tells you how long it has been in that zone, which matters more than the precise current number.
The Three AHR999 Valuation Bands Explained
AHR999 works best as a set of guide rails rather than a mechanical rule. Here is how to interpret each zone.
Below 0.45: The Deep Value Zone
When AHR999 sits well below 0.45, Bitcoin is in historically depressed territory. Price has spent very little time in this region across Bitcoin's history. These periods have clustered around deep value phases and late-stage capitulation when most retail investors are fearful or have already sold.
Staged buying initiated in this zone, particularly when combined with signs that selling pressure is exhausting such as improving realised profit and loss ratios, has historically been one of the strongest long-term accumulation windows.
Being in this zone does not mean prices cannot fall further in the short term. It means the historical risk to reward over a 12 to 24 month horizon has been skewed significantly in favour of buyers.
Between 0.45 and 1.20: The Core Accumulation Band
This is the fixed-investment region and where Bitcoin spends the majority of its time during healthy trending markets.
Dollar-cost averaging, adding on pullbacks that hold near or above the 200-day moving average, and maintaining a core allocation all tend to behave predictably in this zone. Price action is more trend-friendly here and drawdowns are more manageable than in the upper zone.
Most of a typical Bitcoin bull market cycle is spent moving through this band. Systematic buyers who continue accumulating throughout this range without trying to perfectly time tops and bottoms have historically built strong positions heading into later cycle phases.
Above 1.20: The Risk Management Zone
When AHR999 spends sustained time above 1.20, Bitcoin is running hot relative to its historical trend. Upside can continue and often does, but the risk profile changes meaningfully.
Drawdown risk increases in this zone. Pullbacks tend to be sharper. The market becomes more sensitive to negative news and more vulnerable to distribution by longer-term holders who bought lower.
This is not automatically a signal to sell everything. It is a signal to be more selective about adding new exposure, to take partial profits into strength, and to reduce position sizes relative to what was appropriate at lower AHR999 readings.
Practical Thresholds for AHR999
Use these as guide rails, not mechanical rules.
| AHR999 Reading | Zone | Practical Implication |
|---|---|---|
| Below 0.45 | Deep value | Plan staged entries as selling pressure cools |
| 0.45 to 1.20 | Core accumulation | DCA cleanly, add on 200-day pullbacks |
| Above 1.20 | Risk management | Reduce new exposure, take partial profits |
Short fast moves around a threshold are often noise. Step back to the weekly chart and look for persistence before changing your stance.
AHR999 Bitcoin Indicator: How To Use It In Practice
AHR999 tells you the regime. Other indicators confirm what is happening within that regime. Here is how to combine them.
When AHR999 is rising and price is above a rising 200-day average, the backdrop is broadly trending. Adding on pullbacks that respect the 200-day tends to be a cleaner entry approach.
When AHR999 is above 1.20 at the same time as indicators like VDD or CDD show spikes in old coin spending, it can flag distribution into strength. Longer-term holders selling large amounts of previously dormant coins into rising prices is typically a signal to reduce risk rather than chase.
When AHR999 is below 0.45 and the realised profit and loss ratio turns back above one, it suggests that forced sellers have largely cleared and new buying is emerging. That combination supports staged re-risking.
When AHR999 drifts lower while Bitcoin dominance rises, it can signal that speculative altcoin exposure should be reviewed and reduced.
The goal is a small dashboard where AHR999 acts as the long-horizon valuation anchor while other indicators confirm whether behaviour is consistent with accumulation or distribution.
What AHR999 Bands Usually Suggest About Market Context
You do not need the precise current value to make use of the framework. What matters most is how price behaves around the bands over time.
When the index spends most of its time in the fixed-investment band with only brief moves higher, the market is often in a healthy trend. Pullbacks towards the 200-day average can be treated as opportunities if breadth and on-chain data remain constructive.
When AHR999 repeatedly pushes into the upper band without making convincing new highs in price, it can hint at distribution as rallies are used to sell into strength.
When the index has been depressed for an extended period below the lower band and then starts to recover back into the middle band while realised profit and loss measures improve, it often marks the transition from capitulation to rebuilding.
Thinking in terms of these regimes helps you adjust expectations so you are not surprised when volatility and drawdown risk increase near the top of the range.
A Weekly AHR999 Workflow You Can Reuse

- You can fold AHR999 into a simple weekly routine that does not take much time.
- Mark where AHR999 sits relative to the lower and upper bands and note the slope of the 200-day moving average.
A small, consistent routine built around AHR999 helps you treat cycle risk systematically, rather than letting short-term noise dictate your decisions.
AHR999 vs Other Bitcoin Valuation Indicators
AHR999 is one of several long-horizon valuation tools. Understanding how it fits alongside others helps you build a more complete picture.
MVRV Ratio: Compares market cap to realised cap. Tells you whether current holders are broadly in profit or loss. Works well alongside AHR999 to confirm whether the depressed zone reflects genuine capitulation.
SOPR (Spent Output Profit Ratio): Shows whether coins being moved on-chain are being sold at a profit or loss. When SOPR is below 1 in the same period that AHR999 is below 0.45, it confirms that sellers are taking losses, which has historically marked late bear market conditions.
200-day Moving Average: The foundation of AHR999's construction. When price reclaims the 200-day from below while AHR999 is recovering from the lower band, it is one of the more reliable signals that regime is shifting from bear to bull.
Pi Cycle Top Indicator: Designed to identify market tops rather than bottoms. Useful as a complement to AHR999 in the upper band zone where risk management becomes more important.
For the full library of Bitcoin on-chain indicators and how they work together, see the on-chain indicators hub and the On-Chain Indicator Lab.
Frequently Asked Questions
What is the AHR999 index for Bitcoin? AHR999 is a Bitcoin valuation index that compares Bitcoin's current price to its 200-day moving average and groups the relationship into three zones. Below 0.45 is a deep value zone. Between 0.45 and 1.20 is the core accumulation band. Above 1.20 is a high-risk zone. It is used to guide long-term accumulation and risk management decisions.
What is the AHR999 formula? AHR999 divides Bitcoin's current market price by its 200-day moving average and normalises this ratio across historical data. The result is a single number that positions Bitcoin's current price relative to its long-term trend. Below 0.45 indicates depressed conditions, 0.45 to 1.20 indicates a neutral accumulation range, and above 1.20 indicates elevated risk.
Where can I check the current AHR999 value for Bitcoin? The live AHR999 reading is available on Coinglass (coinglass.com) and Bitcoin Magazine Pro. Both platforms show the current reading alongside a historical chart with the three valuation bands marked.
What does an AHR999 value below 0.45 mean? Bitcoin is in a historically depressed zone. These conditions have aligned with deep value phases and late capitulation across past cycles. Staged buying initiated here, confirmed by improving on-chain data, has historically been a strong long-term accumulation window.
What does an AHR999 value above 1.20 mean? Bitcoin is in an elevated risk zone. Gains can continue but drawdown risk increases and pullbacks tend to be sharper. This is a zone to reduce new exposure, take partial profits into strength, and be more selective about adding positions.
Is AHR999 a reliable Bitcoin indicator? AHR999 is a useful long-horizon valuation framework but works best when combined with other on-chain indicators like MVRV, SOPR, and the 200-day moving average. It is not a precise buy or sell signal and should be used as a regime anchor rather than a standalone trigger.
What are Bitcoin valuation bands? Bitcoin valuation bands are price zones derived from long-term metrics that indicate whether Bitcoin is historically cheap, fairly valued, or expensive relative to its trend. The AHR999 index uses three bands: below 0.45 for deep value, 0.45 to 1.20 for accumulation, and above 1.20 for elevated risk.
How is AHR999 different from MVRV? AHR999 is based on Bitcoin's price relative to the 200-day moving average. MVRV compares market cap to realised cap, which is the aggregate cost basis of all Bitcoin holders. Both are valuation tools but they measure different things. Used together they provide a more complete picture of whether Bitcoin is overvalued or undervalued at any given point.
The Markets Unplugged tracks AHR999 alongside MVRV, SOPR, and cycle timing tools in the member dashboard. If you want the data interpreted for you with clear implications for position sizing and cycle timing, explore the membership here.


Discussion