


This is a live analysis published while the April 2026 monthly close is still pending. The outcome and what it means for positioning will be covered in the weekly member update as the month closes. Details on membership here.
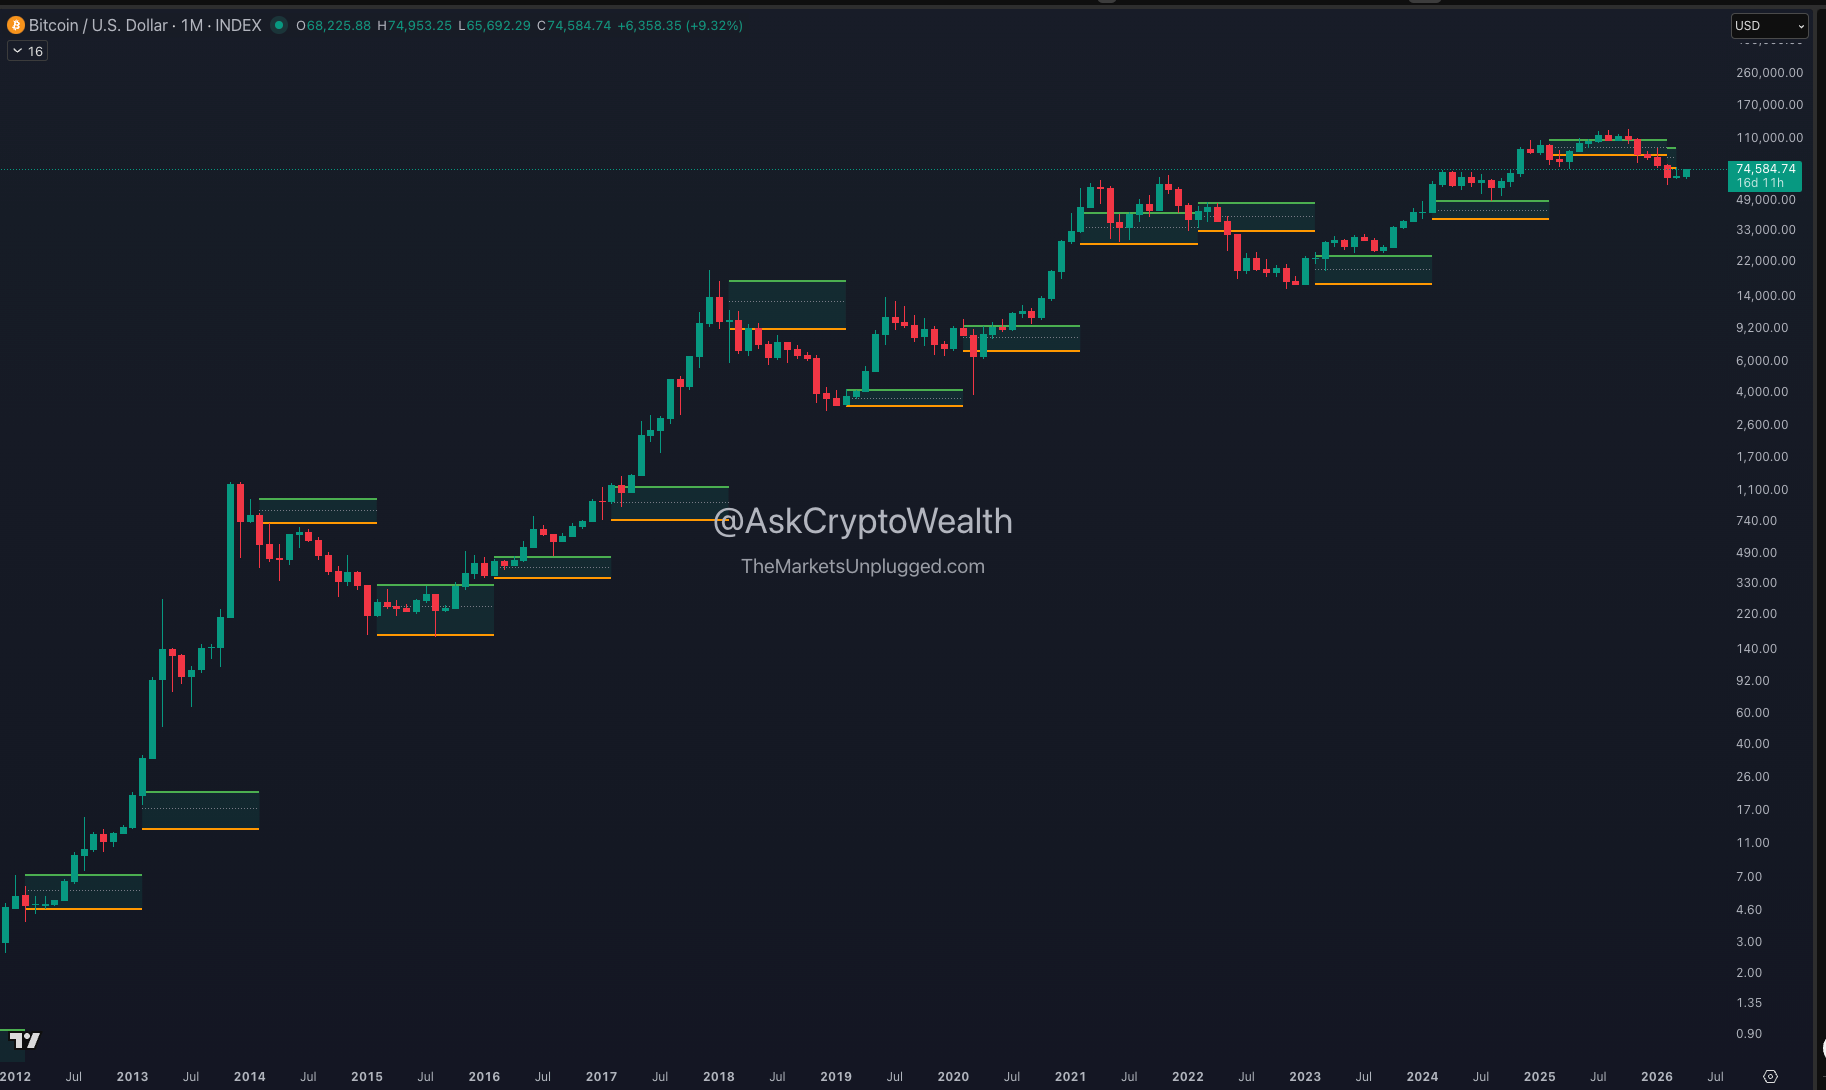
There is a pattern in Bitcoin's monthly chart that most people have never looked at closely enough.
When Bitcoin closes a monthly candle below its January low, it has historically been a serious bearish signal. Not a warning. Not a yellow flag. A signal that has preceded sustained bear markets across Bitcoin's history.
There is one exception. One year where Bitcoin broke below the January low on a monthly close and did not enter a bear market. Where it reclaimed the range the very next month and went on to make new all time highs.
That year was 2020. The trigger was COVID.
February 2026 has now closed below the January low. Bitcoin is currently attempting to reclaim it before April closes. What happens at the end of this month will tell us which path 2026 follows.
This is the full picture.
Why Monthly Closes and Not Intraday Levels
This framework only works on monthly closes. That distinction matters so let me be clear about why.
Intraday wicks happen constantly. Price breaks a level, flushes leveraged positions, scares retail holders, and recovers within hours. Anyone who has traded Bitcoin across a full cycle has seen this play out repeatedly. Reacting to intraday breaks of significant levels is how people get stopped out of good positions.
A monthly close is a completely different signal. It represents where the market settled after four full weeks of information and positioning. Every participant had the entire month to react to whatever was happening in the world. When the candle closes, that is where the market collectively decided to be with everything on the table.
A monthly close below the January low is not noise. It is a statement.
The Normal Pattern: Monthly Close Below January Low Leads to a Bear Market
Going back through Bitcoin's price history on a monthly chart, a clear structural pattern emerges.
The January high and low on monthly closes act as the anchor for the entire year. The January low in particular is the level that separates a year that remains constructive from a year that turns genuinely bearish.
In the years where Bitcoin has closed a monthly candle below the January low and failed to reclaim it quickly, a sustained bear market has followed. This is not a coincidence. It reflects the institutional reality of how capital is deployed.
January is when institutional investors establish their positions for the year. Fresh capital is deployed. Annual allocations are set. The January low is the level where significant buying absorbed the first meaningful weakness of the year. When price closes a monthly candle below that level, it means the market has rejected the entire base of institutional positioning established in January. The buyers who established positions at and above the January low are now underwater. Risk management kicks in. Selling accelerates.
The result in most historical instances has been a prolonged bear market rather than a quick recovery.
The Exception: COVID March 2020
March 2020 broke the pattern.
The COVID pandemic triggered one of the sharpest market collapses in modern financial history. Bitcoin was sold alongside everything else as institutional investors liquidated risk assets across the board. The January 2020 low had held through January and February. March broke it on a monthly close.
By every historical precedent, that should have been the beginning of a sustained bear market.
It was not.
April 2020 closed back above the January low. One month. Bitcoin reclaimed the range before the bear market had a chance to establish itself. The Federal Reserve announced unprecedented stimulus. Macro fear normalised faster than almost anyone expected. Organic demand returned.
What followed was one of the strongest bull runs in Bitcoin's history. From the March 2020 low near $4,000 to $69,000 by late 2021.
The key distinction between the COVID setup and the normal bear market pattern is the speed of the reclaim. Bitcoin did not spend multiple months below the January low. It broke below in March and reclaimed in April. That rapid recovery back inside the range is what classified 2020 as an anomaly rather than a bear market signal.
The lesson from COVID is not that breaking the January low is always recoverable. It is that when the break is driven by extreme but temporary macro fear rather than by a structural deterioration of the market, the reclaim can happen quickly. And when it does, the upside that follows has historically been significant.
February 2026: Which Pattern Does It Follow?
The trigger in February 2026 was geopolitical fear around the Iran conflict. Risk assets sold off broadly. Bitcoin, which has consistently traded as a correlated risk asset during macro fear events throughout 2025 and 2026, was sold alongside equities and other risk assets.
February 2026 closed below the January 2026 low of approximately $75,500.
The question the market is now answering in real time is simple. Is this 2020 or is this the normal pattern?
Two additional signals suggest this could be closer to the COVID anomaly than a standard bear market break.
The BTC/VIX trendline
At the same time Bitcoin broke the January low in February 2026, the BTC/VIX ratio touched its long-term trendline support. This is a cross-market signal that has marked the low of every major fear-driven Bitcoin selloff since 2019, across five completely different macro environments including COVID, the SVB banking crisis, the yen carry trade unwind, and the April 2025 tariff wars.
The full analysis of the BTC/VIX framework and its track record is covered in detail here: The Chart That Has Called Every Fear-Driven Bitcoin Bottom Since 2020.
In March 2020, the BTC/VIX trendline was also touched at the same time the January range broke on a monthly close. Two independent signals firing simultaneously at the same low. That exact combination has now appeared again in February 2026.
The nature of the macro trigger
The Iran conflict, like COVID, is a fear-driven macro event rather than a structural economic deterioration. Geopolitical fear events tend to produce sharp spikes in risk-off sentiment that normalise faster than structural economic problems like a banking crisis or a prolonged recession. When the trigger is fear rather than fundamental damage, the conditions for a rapid reclaim are more favourable.
This does not guarantee a reclaim. It is context that, combined with the BTC/VIX signal, shifts the probability weighting toward the COVID scenario rather than the standard bear market pattern.
The Three Scenarios for April 2026
April 2026 has approximately two weeks remaining. The monthly close on April 30 is the only data point that matters for this framework.
Scenario one: April closes above $75,500
Bitcoin reclaims the January low on a monthly close. This matches the COVID precedent precisely. The bear market signal is cancelled. Traders who positioned short on the monthly close break below the January low are wrong and must cover. That covering adds buying pressure on top of returning organic demand. The historical implication of this scenario, based on the only prior precedent, is significant upside over the following months.
Scenario two: April closes below $75,500 but above the February low
The reclaim attempt is ongoing but unconfirmed. May becomes the decisive month. The longer Bitcoin spends below the January low on monthly closes, the more the setup shifts from the COVID anomaly toward the standard bear market pattern. Time matters here.
Scenario three: April closes significantly below $75,500
The normal historical pattern takes over. The bear market signal is confirmed rather than cancelled. This scenario requires a reassessment of the broader cycle position and identification of the next meaningful structural support levels on the monthly chart. The BTC/VIX framework would also need to be re-evaluated if the trendline support fails to hold across subsequent months.
What to Watch Into the Monthly Close
Primary signal: April 30 monthly close relative to $75,500. This is the only number that matters for this framework.
BTC/VIX: Already touched the long-term trendline in February. Is it recovering as the VIX normalises? A recovering ratio alongside a price reclaim attempt mirrors the April 2020 setup almost exactly.
MVRV: Is it recovering from depressed levels? On-chain cost basis metrics recovering alongside the price attempt suggests accumulation rather than distribution at current levels.
Exchange outflows: Coins moving to cold storage rather than onto exchanges for selling is consistent with a market that is accumulating at the January low rather than distributing into it.
The most important thing: Do not react to intraday moves or weekly closes between now and April 30. They are noise relative to this framework. The monthly close is the signal.
The Broader Point
This framework works because Bitcoin operates within a structure that most pure crypto analysis ignores. The institutional calendar matters. The January range is not an arbitrary level. It is where capital was deployed, where positions were established, and where the market set its anchor for the year.
When that anchor is broken on a monthly close, it has historically been significant. The question 2026 is currently answering is whether the break is temporary, driven by extreme but passing fear, or whether it represents a genuine rejection of the year's opening range that leads to the pattern historical precedent says usually follows.
The BTC/VIX trendline touch, the nature of the Iran conflict as a fear-driven rather than structural event, and the current price attempting to reclaim the range all point toward the COVID scenario. But the monthly close is the verdict.
April 30 is the date. $75,500 is the level. Everything else is noise until then.
Frequently Asked Questions
What is the Bitcoin January range? The high and low established during January each year on a monthly close basis. These levels act as structural reference points throughout the year. A monthly close below the January low has historically been a significant bearish signal in most years.
Does a monthly close below the January low always lead to a bear market? Historically yes, with one exception. March 2020 during the COVID crash saw Bitcoin close below the January low but reclaim it the following month in April 2020, avoiding the bear market entirely and going on to make new all time highs. February 2026 is only the second time this situation has occurred.
What makes the COVID 2020 setup different? The speed of the reclaim. Bitcoin broke below the January low in March 2020 and reclaimed it in April 2020. One month. That rapid recovery back inside the January range is what classified it as an anomaly rather than a bear market confirmation. The longer price spends below the January low on monthly closes, the more it follows the standard bear market pattern.
What is the January 2026 range? Monthly close low approximately $75,500. Monthly close high approximately $98,000. February 2026 closed below $75,500. April 2026 is currently attempting to reclaim that level with the monthly close still pending on April 30.
What is the key date and level to watch? April 30 2026. The monthly close. Above $75,500 follows the COVID anomaly pattern. Below $75,500 shifts toward the standard bear market pattern. Everything before April 30 is noise relative to this framework.
How does the BTC/VIX analysis connect to this? Both signals fired simultaneously in February 2026, the same combination that appeared in March 2020. The BTC/VIX trendline has marked every major fear-driven Bitcoin low since 2019. Its appearance alongside the January range break adds significant weight to the possibility this is the COVID anomaly rather than a standard bear market signal. Full analysis here: The Chart That Has Called Every Fear-Driven Bitcoin Bottom Since 2020.
The April monthly close and what it means for cycle positioning will be covered in real time in the weekly member update. Members get the full picture across KAIROS timing, on-chain data, and macro signals every week. Explore membership here.


Discussion