


Key Points
- NFCI is the Chicago Fed’s broad weekly scoreboard of US financial conditions, it blends money markets, credit, equities, and banking inputs.
- ANFCI adjusts NFCI for economic activity and inflation, it aims to isolate the pure financial impulse.
- Above 0 is tighter than average, below 0 is looser than average, persistence matters more than a single print.
- Use NFCI and ANFCI together, then confirm with credit spreads, DXY, and real yields to avoid false signals.
- For more guides like this, use the Macro For Beginners hub.
- If you want quick definitions for terms like credit spreads, real yields, DXY, and repo, see the Crypto Glossary.
Quick Answer
Financial conditions wrap funding costs, credit spreads, equity performance, rates, and money-market stress into one read. The Chicago Fed’s NFCI is the raw index. The ANFCI adjusts that index for contemporaneous macro conditions (activity and inflation). Positive values are tighter than average, negative values are looser than average, and the slope matters more than a one-week wobble.
NFCI and ANFCI matter because they summarise whether the system is making it easier or harder to fund risk. When the indices trend higher with persistence, risk premia usually expand and the tape gets pickier. When they trend lower with persistence, conditions ease and risk assets usually get better air. Use both indices together, then cross-check credit spreads, the dollar, and real yields to confirm the impulse.
What Are Financial Conditions?
Financial conditions are a combined read of how easy or hard it is to borrow, hedge, and take risk.
What NFCI tries to capture:
- Funding conditions: money markets, repo, and short-term stress
- Credit conditions: spreads, lending tone, default risk pricing
- Risk tone: volatility, equity stress, cross-asset risk appetite
- Leverage signal: how stretched balance sheets are
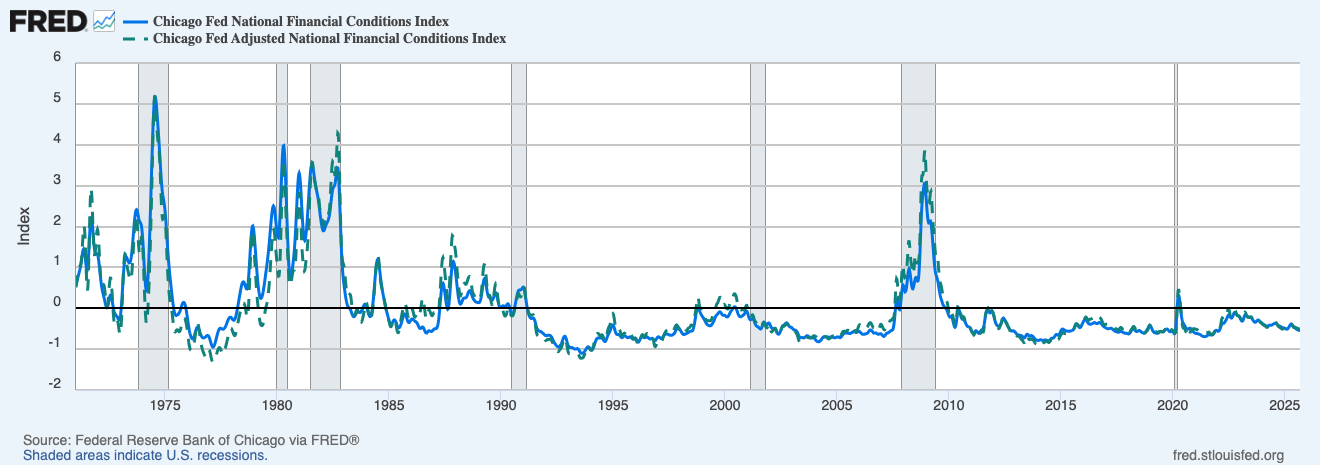
This chart shows how tightening episodes cluster around stress events, while long, steady negative periods often align with easier cycles. Use the trend, not the week-to-week noise.
NFCI Vs ANFCI: What Is The Difference?
- NFCI: the raw blend of a large set of financial indicators.
- ANFCI: the same concept, but adjusted for the state of the economy, so you can see whether conditions are tight or loose relative to the current growth and inflation backdrop.
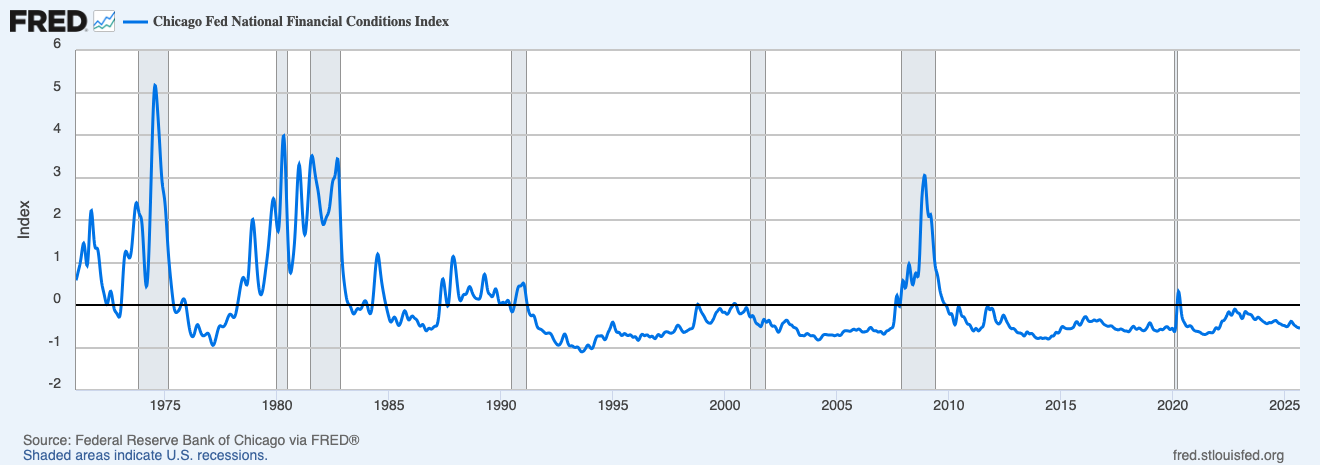
NFCI spikes tend to be short and violent, but the more useful signal is the build-up, the slow grind higher before the spike.
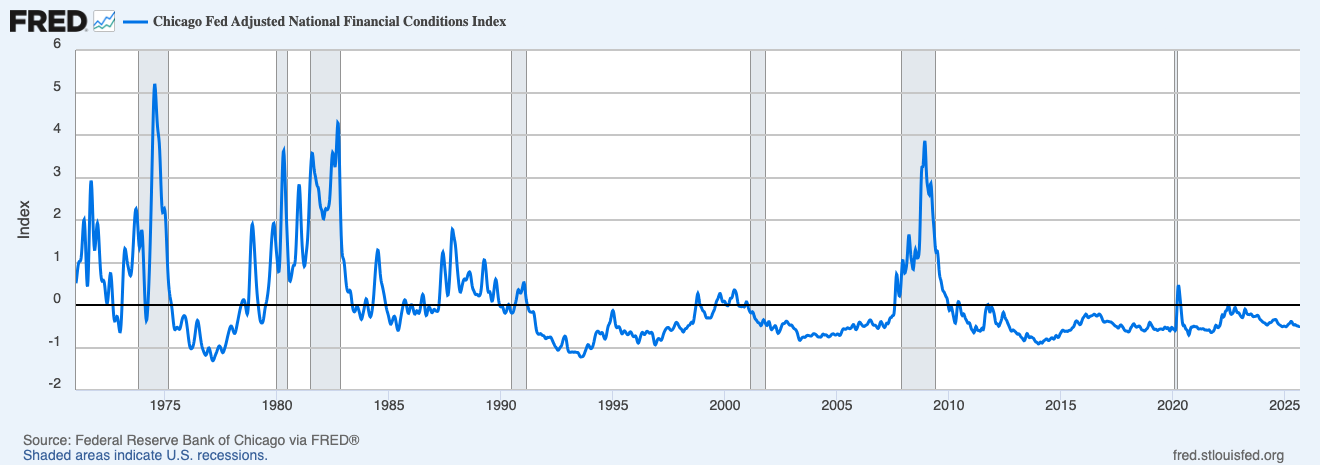
ANFCI can move earlier at turning points when growth or inflation is masking the true impulse. Treat it as a “cleaner lens”, not a replacement.
Practical Thresholds
These are guide rails, not gospel. Prioritise direction and persistence.
- Below about -0.5 and stable: broad ease, carry and issuance flow, beta often travels better.
- Rising toward 0 from below with persistence: early tightening, respect risk until it stalls.
- Sustained moves above 0: restrictive backdrop, risk premia expand and funding gets pickier.
- Fast round trips around events: often noise, wait for a weekly close before changing stance.
How To Pair NFCI With Other Dials
Stronger tightening signal:
- NFCI rising with high-yield spreads widening, and volatility firmer (MOVE or VIX)
Cleaner easing signal:
- NFCI easing while DXY softens, and 10-year real yields drift lower
Early warning mix:
- ANFCI rising while NFCI is flatter, underlying tightening can be forming even if the macro tape still looks “fine”
Energy headline trap:
- Oil spikes can move inflation expectations fast, check ANFCI to see if conditions are actually tightening under the hood
What The Long-Term Charts Usually Show
- Tightening episodes often cluster around recessions and stress events, spikes are short, but the damage usually comes from the build-up.
- Long stretches below 0 often align with easier conditions for risk assets, the best environments are persistent, not one-week dips.
A Simple Workflow You Can Reuse
- Keep NFCI and ANFCI on a long window, mark each week as looser, tighter, or flat.
- Cross-check credit spreads, DXY, 10-year real yields, and liquidity plumbing (RRP and bank reserves) for alignment.
- Into CPI, payrolls, and FOMC, expect short bursts that fade, react once you see two or three weekly moves in the same direction.
- For crypto risk tolerance, conditions are usually friendlier when ANFCI trends down with a softer dollar and steady to easier credit, conditions are usually harsher when both indices grind up and credit widens.
- Review weekly, persistence beats headlines.
Mini FAQs
Which Should Be Trusted More, NFCI Or ANFCI?
Use both. ANFCI filters macro noise, NFCI shows the raw state of financial markets.
Do Absolute Levels Matter, Or Just The Change?
The turn with persistence matters most. Levels help with context and historical comparison.
Why Can Markets Rally While NFCI Tightens?
Positioning and micro flows can dominate for weeks. If tightening persists, risk often reprices later.
If this helped you read “tight vs loose” without guesswork, join Alpha Insider for Macro Heat dashboards, calendar previews for the next prints, and a weekly positioning watchlist.
Alpha Insider members also get:
➡️ Kairos timing windows to plan entries before the crowd moves
➡️ A full DCA Targets page with levels mapped for this cycle
➡️ Exclusive member videos breaking down charts in plain English
➡️ A private Telegram community where conviction is shared daily
➡️ A dedicated Macro Analysis page with regularly updated analysis and monthly reports
Legal And Risk Notice
This content is for educational purposes only and is not financial advice. Markets are volatile and you can lose money. Do your own research and consider your risk tolerance before making financial decisions.


Discussion