


Key Points
- IG OAS is the cleaner early-warning dial for slow tightening, HY OAS is the louder panic dial when funding shuts.
- The IG vs HY gap often tells you where stress is building first, lower quality tends to crack before the system does.
- Direction and persistence matter more than any one-day spike, use weekly follow-through.
- Pair spreads with DXY and real yields to avoid false signals and to judge whether conditions are tightening or easing.
- For more macro dials like this, use the Macro For Beginners hub.
- If you want quick definitions for terms like OAS, DXY, and real yields, see the Crypto Glossary here.
Quick Answer
IG OAS (investment-grade option-adjusted spread) shows how much extra yield high-quality companies pay over Treasuries. HY OAS (high-yield option-adjusted spread) shows the same for lower-quality, higher-default-risk borrowers. IG moves in tighter ranges and can reveal a slow tightening in financial conditions before HY blows out. HY reacts faster and swings harder when stress becomes obvious.
IG OAS matters because it often signals the early drift in funding conditions, weeks before headlines catch up. HY OAS matters because it confirms when stress is no longer subtle and risk is being repriced aggressively. Read both together, and focus on trend and persistence, then cross-check DXY and real yields to confirm whether the macro tape is tightening or easing.
What Is IG OAS, And How Is It Different To HY OAS?
- OAS: Option-adjusted spread over Treasuries, a cleaner way to compare credit risk.
- IG OAS: Higher-quality corporates, steadier balance sheets, defaults are rarer, moves are smaller but informative.
- HY OAS: Lower-rated debt, reacts faster, swings wider, and tends to spike when funding stress hits.
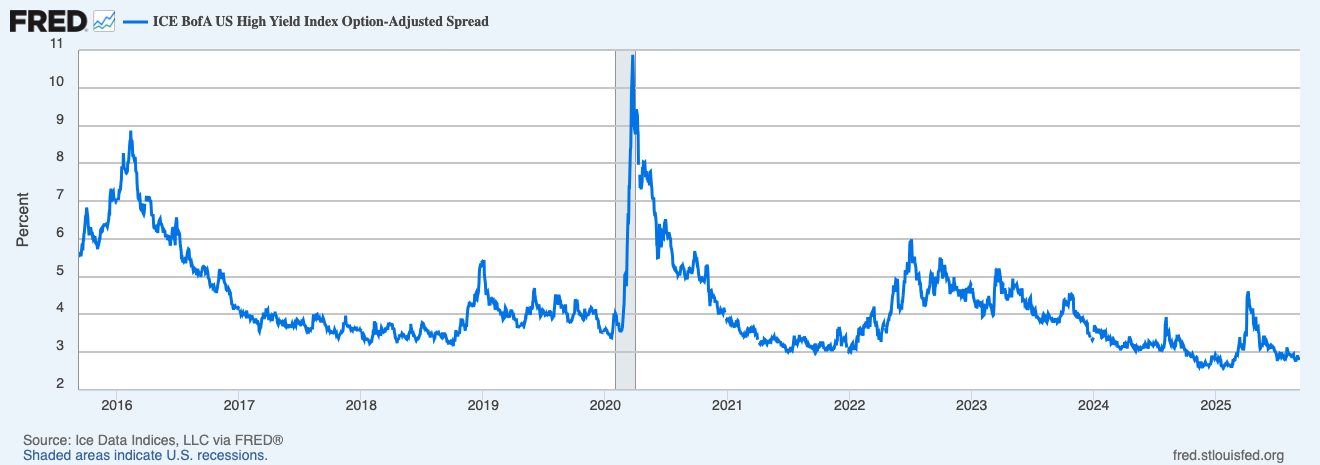
HY OAS makes stress obvious because it moves quickly when risk is repriced. Use it to confirm when conditions have shifted from “tightening” to “stress”.
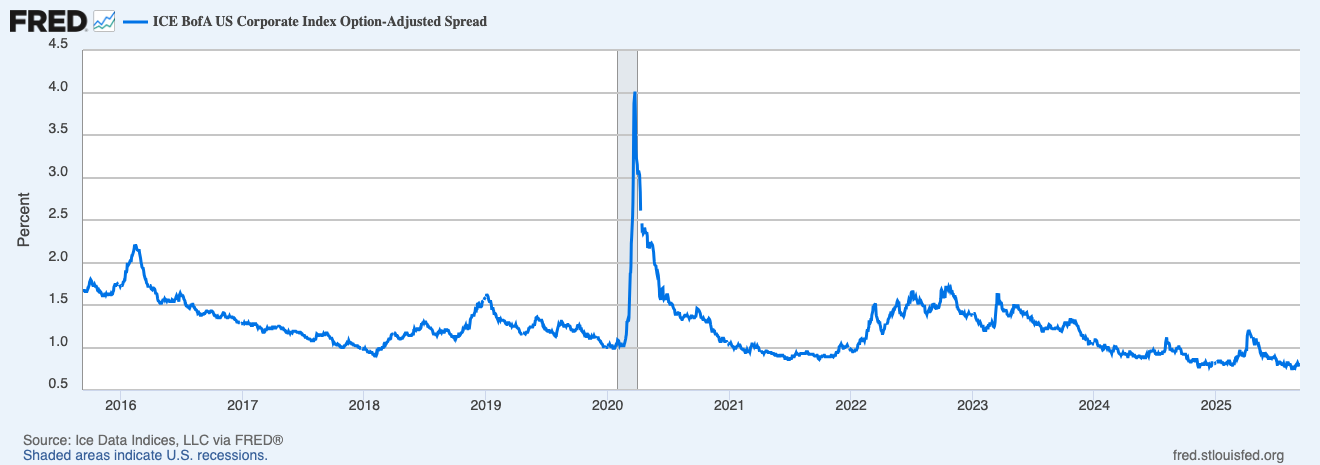
IG OAS lives in tighter ranges, which makes the slope more important than the level. A slow grind higher for weeks often signals quiet tightening in the system.
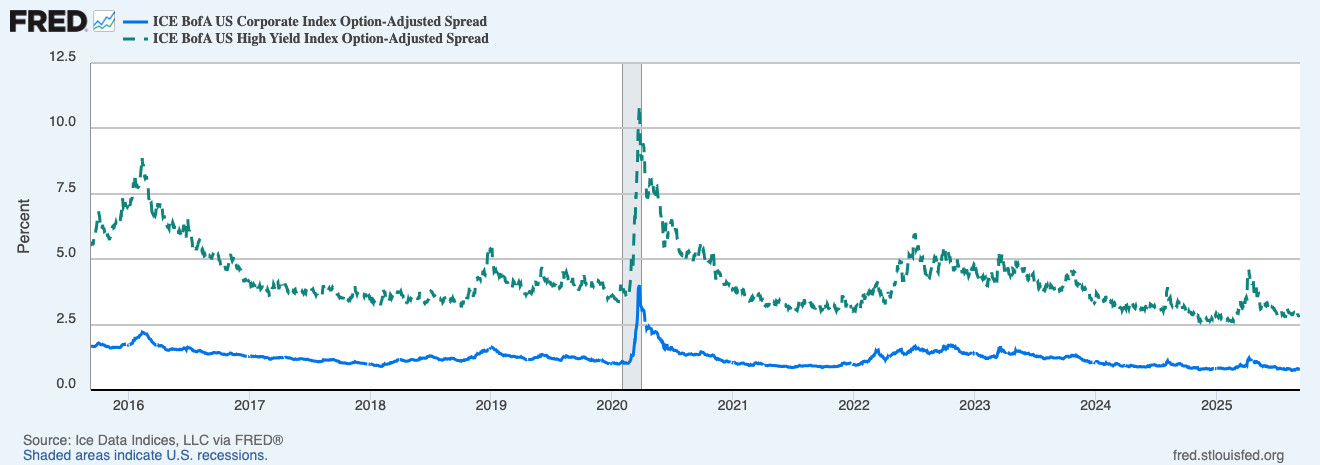
The gap between HY and IG is often the tell. A widening gap can mean pressure is building in lower-quality credit first, before it spreads wider.
What IG Tells You That HY Often Doesn’t
- Early Regime Drift: IG can edge higher before HY reacts, signalling a slow leak in liquidity rather than a headline shock.
- Systemic Tone: IG widening while HY is flat can still mean funding is getting pricier across the board, not just in junk.
- Policy Transmission: IG tends to respond to real-yield moves and broad financial conditions with less noise, which can make it a cleaner macro read.
Practical Guide Rails
These are guide rails, not gospel. Ranges shift by cycle, so treat persistence as the main signal.
- IG OAS around 80 to 120 bps: easier conditions, refinancing is smoother, carry tends to work.
- IG OAS rising through about 130 to 150 bps with persistence: caution, conditions are tightening, respect risk until it stalls.
- HY OAS above about 500 to 600 bps while IG lifts toward about 150 bps: proper tightening, risk tolerance usually drops.
How To Read The HY Minus IG Relationship
- HY Up, IG Stable: lower-quality stress first, equities can lag by days.
- HY Up, IG Up: broader de-risking, tighter conditions across credit.
- HY Down, IG Flat: risk returning at the margin, still a cautious green light.
- Gap Compressing With Softer DXY And Easier Real Yields: friendlier backdrop for duration and crypto beta.
Watch-Outs
- Index Rebalances: month-end moves can nudge OAS for a session, look for weekly persistence.
- Post-FOMC Whipsaws: wait a day or two for follow-through before changing your view.
- Single-Name Blow-Ups: HY headlines can distort sentiment, the index trend matters more than one story.
- Sector Distortions: oil spikes can widen HY energy without a broad turn, confirm with IG.
A Simple Workflow You Can Reuse
- Keep IG OAS and HY OAS on screen together, mark weekly direction, not just the daily print.
- Track the HY minus IG gap, a rising gap is often the early canary.
- Cross-check DXY and 10-year real yields, if they tighten too, conviction rises.
- Map the read to risk tolerance, tightening conditions usually reduce appetite for high beta.
- Review weekly, persistence beats headlines.
Mini FAQs
Why Use OAS Instead Of Yield-To-Worst?
OAS adjusts for embedded options and improves comparability across bonds, so it is often a cleaner spread for risk.
Does IG Ever Lead HY?
Yes. Slow, steady IG widening can precede a HY spike when liquidity thins and stress becomes visible.
Are Levels Comparable Across Cycles?
Not perfectly. Policy, inflation, and issuance change the baseline, so use thresholds as context and focus on trend and persistence.
If this helped you read credit spreads with more clarity, Alpha Insider is where macro dials, timing context, and repeatable workflows get pulled into one place.
Alpha Insider members get:
➡️ Kairos timing windows to plan entries before the crowd moves
➡️ A full DCA Targets page with levels mapped for this cycle
➡️ Exclusive member videos breaking down charts in plain English
➡️ A private Telegram community where conviction is shared daily
➡️ A dedicated Macro Analysis page with regularly updated analysis and monthly reports
Everything you need… nothing you don’t.
Legal And Risk Notice
This content is for educational purposes only and is not financial advice. Markets are volatile and you can lose money. Do your own research and consider your risk tolerance before making financial decisions.


Discussion