


Key Points
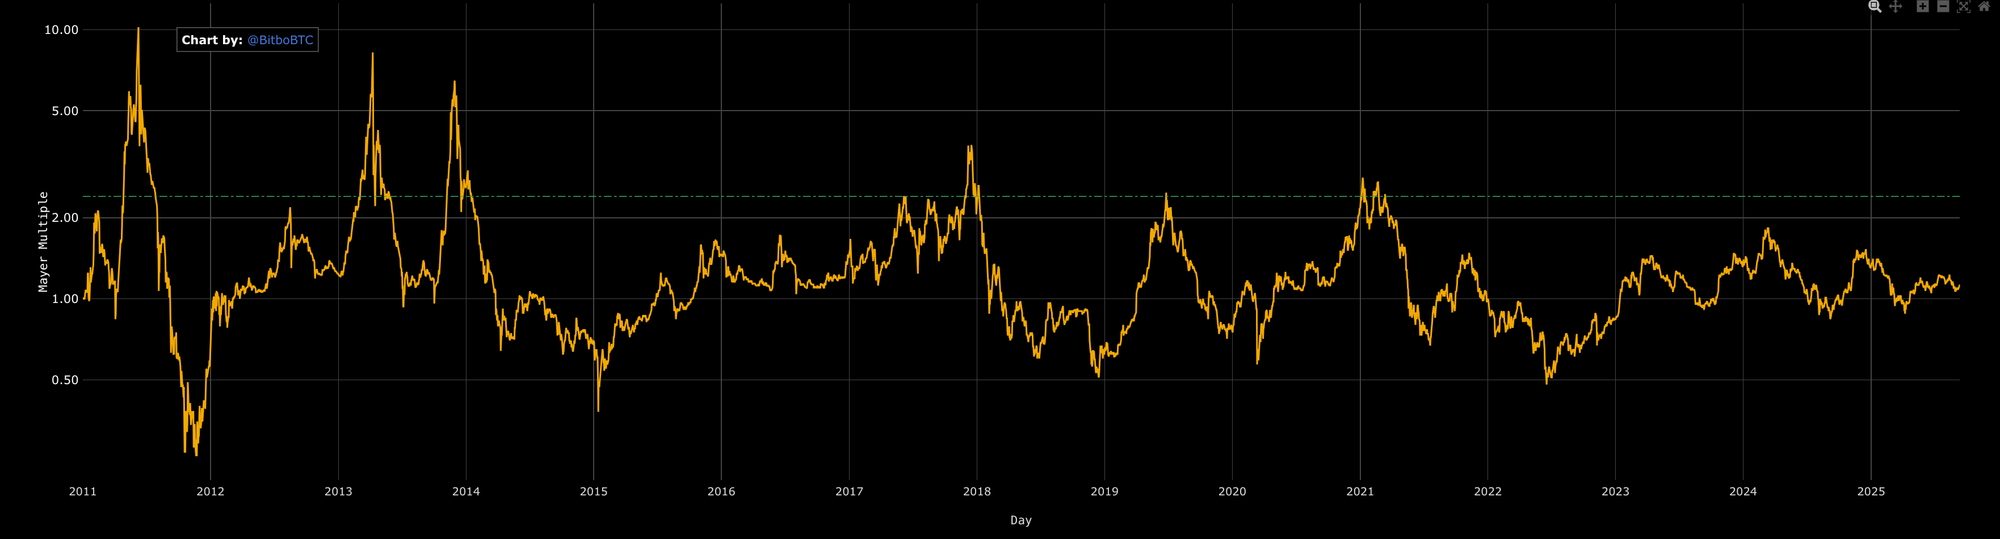
- The Mayer Multiple is Bitcoin price divided by the 200-day moving average, a simple way to measure how stretched price is versus a long-term baseline.
- Mayer Multiple bands turn that ratio into zones, helping you separate value conditions from overheated conditions without reacting to short-term noise.
- The strongest use is regime context and risk framing, not one-off signals.
- Repeated time in the upper zones tends to mean risk is rising, especially if other indicators confirm distribution behaviour.
- Time in the lower zones can flag depressed conditions, but confirmation still matters before treating it as a durable reset.
- Weekly checks are usually enough for most readers.
- This guide is part of the Bitcoin on-chain series. For the full library of indicators and explainers, see the Bitcoin on-chain indicators hub.
- If any terms feel unfamiliar, use the Crypto Glossary, then return here.
What is the Mayer Multiple… and why use bands?
The Mayer Multiple is simply price divided by its 200-day moving average. It tells you how stretched price is relative to a long trend baseline. Bands wrap that ratio into coloured zones so you can act without second-guessing… from deep value to overheated.
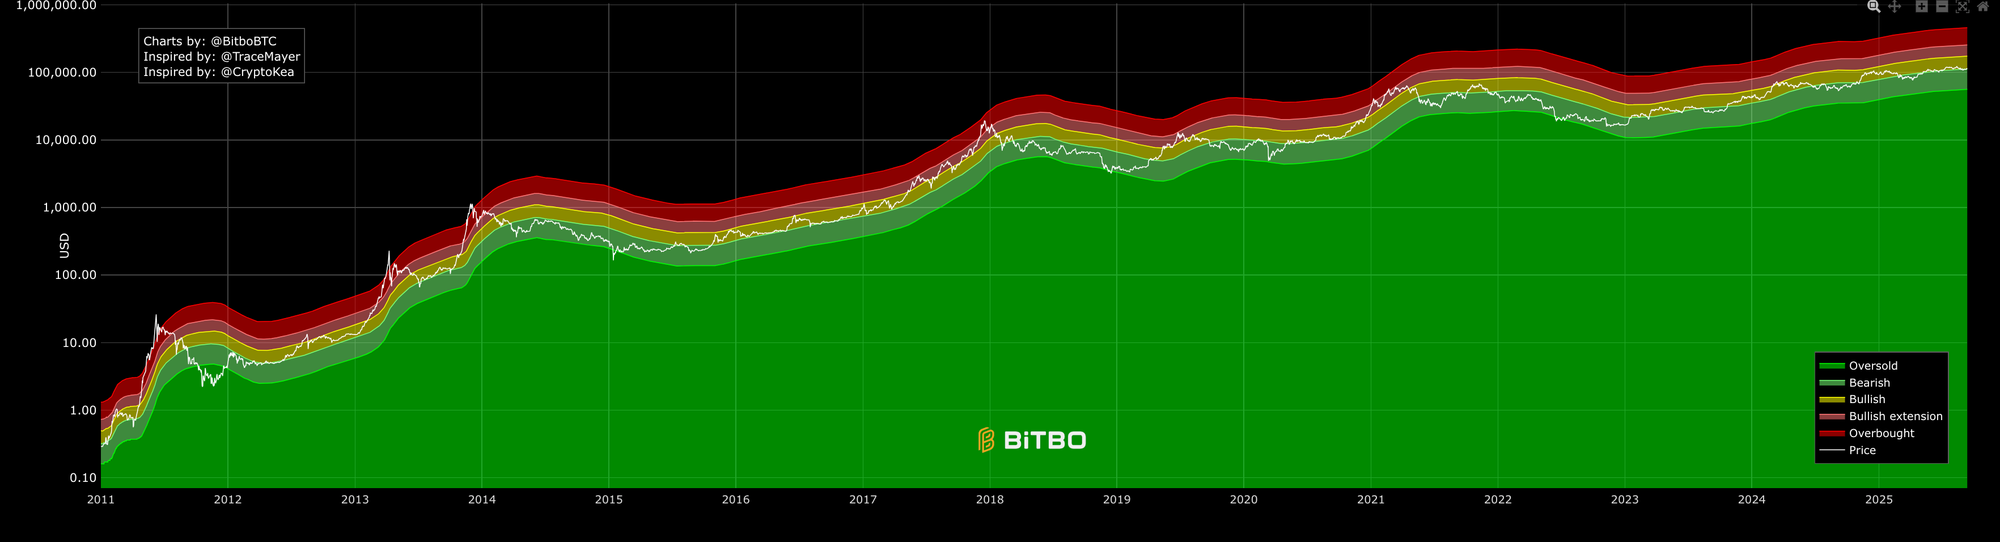
How to read the bands… from value to heat
- Oversold zone (green)… price sits well below the 200-day average or the ratio is depressed… historically where staged adds work best once trend stabilises.
- Bearish zone (dark green to olive)… recovery phase… respect the 200-day slope and wait for reclaim signals before size.
- Bullish zone (yellow)… trend is healthy… buy-the-dip and trail stops.
- Bullish extension (orange)… strong tape but getting punchy… trims on spikes make sense.
- Overbought zone (red)… stretched relative to history… great tape can continue, but risk-reward compresses.
The zones are a guide… not gospel. Always pair with trend and breadth.
Key thresholds that have mattered
- MM ≈ 1.0… price at the 200-day… bias flips with the slope of the 200-day.
- MM 0.8 to 0.9… historically where swing adds have paid once downside momentum cools.
- MM 1.5 to 2.0… hot but workable in strong cycles… manage with trailing exits.
- MM ≥ 2.4… late-stage heat in prior cycles… distribution risk rises if price stops making fresh highs.
Entries, risk, and trims… a simple playbook
Entries
- Start with starter size when MM reclaims 1.0 and the 200-day turns up.
- Add on dips that hold above the 200-day or the bullish band midline.
Risk
- If MM loses 1.0 and the 200-day rolls down, reduce and wait for the reclaim.
- Treat MM < 0.9 as a value zone only when downside momentum cools… don’t catch knives.
Trims
- Clip strength when MM pushes into orange repeatedly without new highs.
- Scale trims if MM sits in red and breadth or on-chain dials show distribution.
Pairing the bands with other dials
- MM rising + Realised PnL Ratio > 1.0… profit is being accepted… adds are cleaner.
- MM in orange/red + VDD or CDD spikes… old coins distributing into strength… trim risk.
- MM reclaiming 1.0 + funding cool + OI rebuilding… rotation entries line up.
- MM losing 1.0 + breadth weak… protect capital… wait for structure to repair.
What the charts are saying right now
The bands show long stretches where the bullish zone carried trend, punctuated by short trips into red near blow-offs. The standalone ratio flags the same… repeated pushes toward the high zone that fail to extend are where trimming pays. Cooling back toward 1.0 without breaking the 200-day is usually digestion… not doom.
A weekly workflow you can reuse
- Mark whether MM is above or below 1.0 and note the 200-day slope.
- Tag the band you’re in… oversold, bearish, bullish, extension, or overbought.
- Plan actions… add only on reclaims above 1.0… trim into extension when price stalls.
- Cross-check RPLR, CDD/VDD, and RHODL for distribution vs reset.
- Review each week… persistence beats headlines, innit.
Mini FAQs
What does the Mayer Multiple tell you in simple terms?
It shows whether Bitcoin is stretched above or below its 200-day moving average, using a simple ratio.
Do the bands predict tops and bottoms?
No. They frame conditions. The cleaner signal comes from persistence in a zone and confirmation from other indicators.
Why do different charts show different band levels?
Band settings vary by provider. Focus on the concept and the zone behaviour, then verify the exact settings on the chart you use.
Is the 200-day moving average still relevant in crypto?
It is widely watched and often acts as a long-term baseline, but it should be used as context alongside on-chain behaviour and liquidity conditions.
What should confirm a Mayer Multiple read?
Use cost basis tools such as realised price bands or MVRV, and behaviour tools such as SOPR or realised profit and loss, plus exchange flows to judge venue pressure.
How often should it be checked?
Weekly is usually enough. Daily checks can create false urgency without changing the bigger picture.
If this helped you use the 200-day baseline with more confidence, Alpha Insider members can access deeper Bitcoin on-chain analysis and commentary here.
Alpha Insider members get:
➡️ Kairos timing windows to plan entries before the crowd moves
➡️ A full DCA Targets page with levels mapped for this cycle
➡️ Exclusive member videos breaking down charts in clear, simple terms
➡️ A private Telegram community where conviction is shared daily
Built for steadier weekly context… updated week to week.
Legal And Risk Notice
This content is for education only and does not constitute financial advice. Crypto assets are volatile and you can lose money. Always do your own research and consider your risk tolerance.


Discussion