


Key Points
- Realised capitalisation (Realised Cap) values each coin at the price it last moved on-chain, then sums across the network… a cleaner proxy for committed capital than spot-based market cap.
- Market cap reprices the entire supply every tick. Realised cap only changes meaningfully when coins move at new prices, so it filters a lot of noise.
- When realised cap is rising, the network’s aggregate cost basis is being upgraded… demand is absorbing supply at higher prices.
- When price rallies but realised cap stays flat, the move can be more fragile, because little new cost basis is forming beneath the surface.
- Realised cap is the foundation for several core indicators, including MVRV, realised price bands, and many cost-basis regime reads.
- Weekly reads are usually enough for most people… daily checks often add urgency without adding clarity.
- This guide is part of the Bitcoin on-chain series. For the full library of indicators and explainers, see the Bitcoin on-chain indicators hub.
- If any terms feel unfamiliar, use the Crypto Glossary, then return here.
Quick Answer
Realised cap measures how much capital is actually committed on-chain, by valuing each coin at the price it last moved. That makes it a cost-basis anchored alternative to market cap, which reprices the whole supply at today’s spot. Use realised cap to judge whether an advance is being supported by real repricing in the network’s cost basis, then confirm with MVRV, realised price bands, and behaviour indicators like SOPR or realised profit and loss before forming a view.
What Is Realised Capitalisation?
Realised Capitalisation (Realised Cap) values each coin at the price it last moved on-chain, then sums that value across the network. It tracks how much capital is actually committed at recorded transaction prices, not the hypothetical value of every coin at today’s spot.
How Is It Calculated?
- For each UTXO, take the price when it last moved.
- Multiply by its coin amount.
- Sum across all UTXOs.
- Result: Realised Cap in USD.
Because coins only “reprice” when they move, Realised Cap steps up during broad accumulation and cools or flattens when coins sit still or realise losses.
Why Realised Cap Beats Market Cap for Signal
- Anchored to behaviour: it moves when holders actually transact at new prices, not with every tick in spot.
- Smoother cycle read: it filters noise and shows whether demand is upgrading the network’s cost basis.
- Fakeout filter: price spikes with a flat Realised Cap often fade; rising Realised Cap confirms real capital commitment.
Reading the Attached Charts
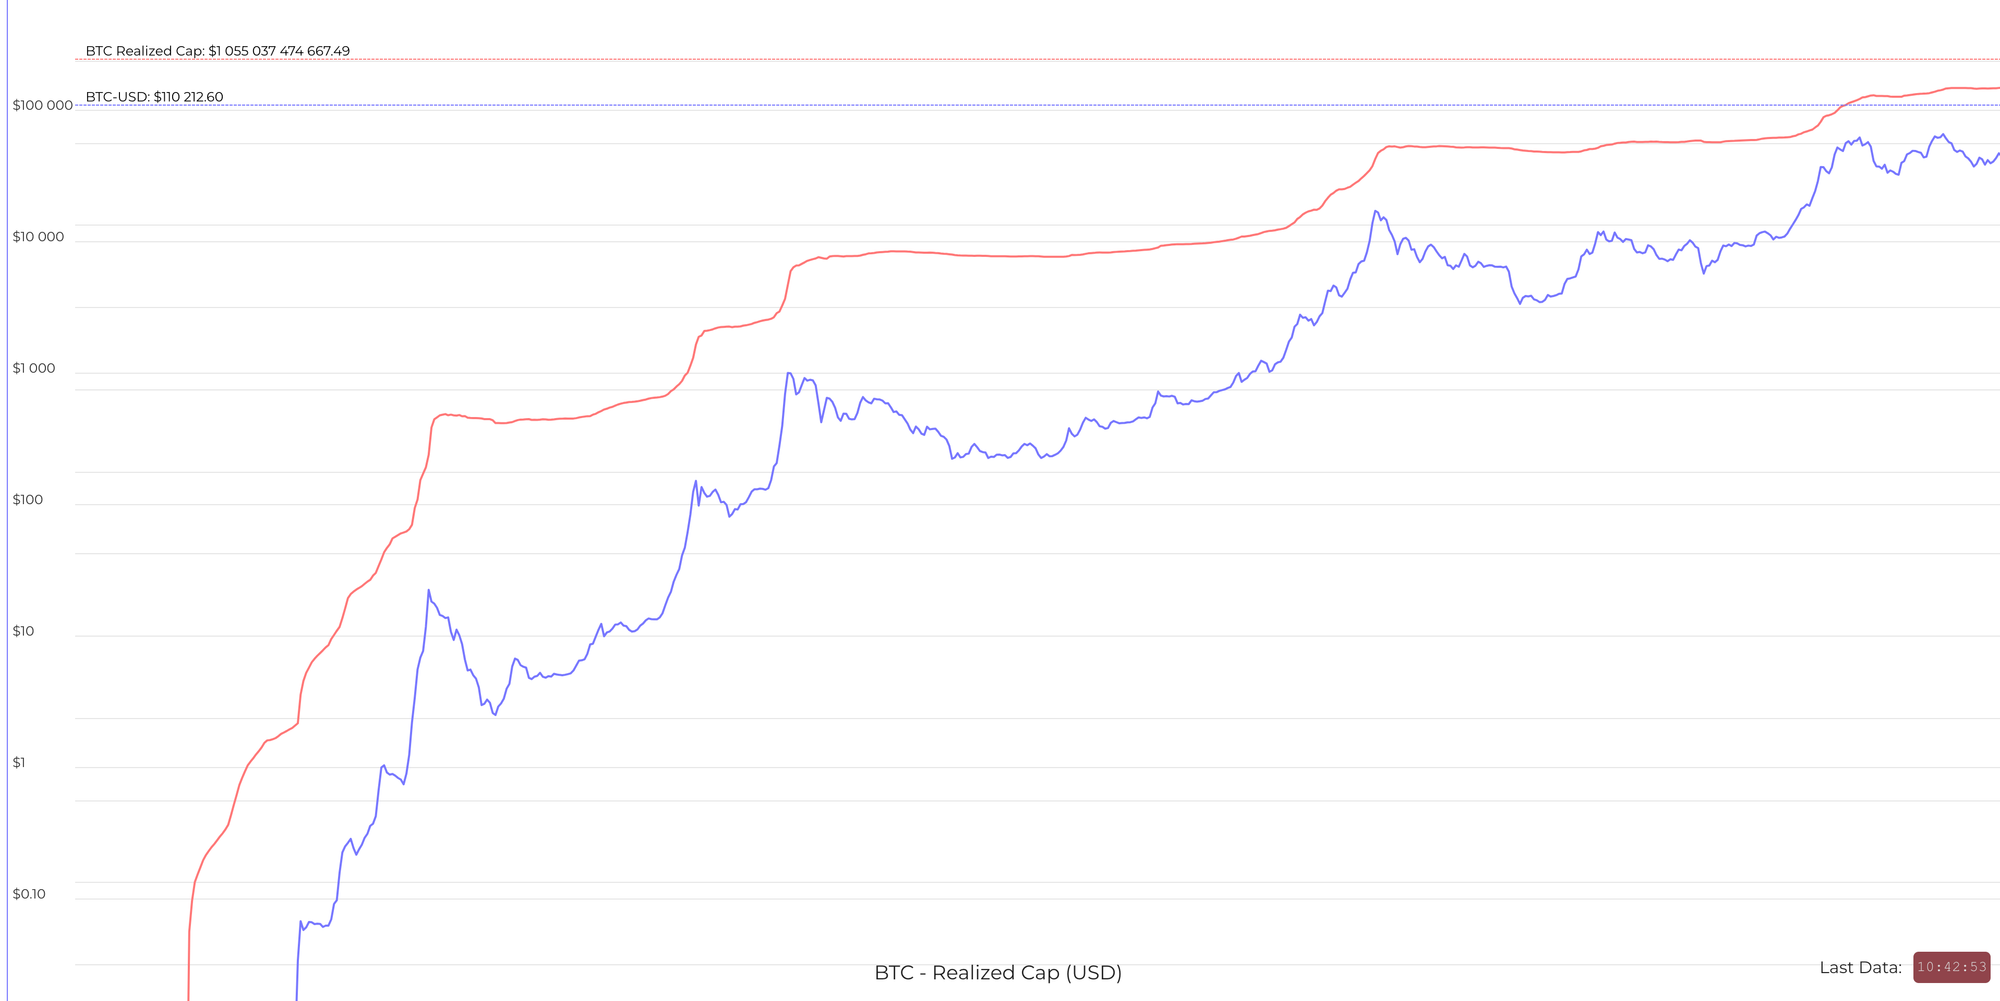
This chart shows Realised Cap (red) rising in step-like advances while price (blue) swings around it, revealing when capital truly re-prices higher.
Key reads from this panel
- Stair-steps upward after bears: plateaus in Realised Cap during late-bear phases give way to steady climbs as coins change hands at higher prices.
- Rising together = healthy advance: when price trends up while Realised Cap also climbs, demand is absorbing supply at higher cost basis.
- Price up, Realised Cap flat = fragile: rallies that leave Realised Cap lagging are more likely driven by leverage/derivatives and tend to unwind.
- Brief dips in Realised Cap: rare but visible during heavy loss-realisation events (capitulation). Persistent declines are uncommon and usually short-lived.
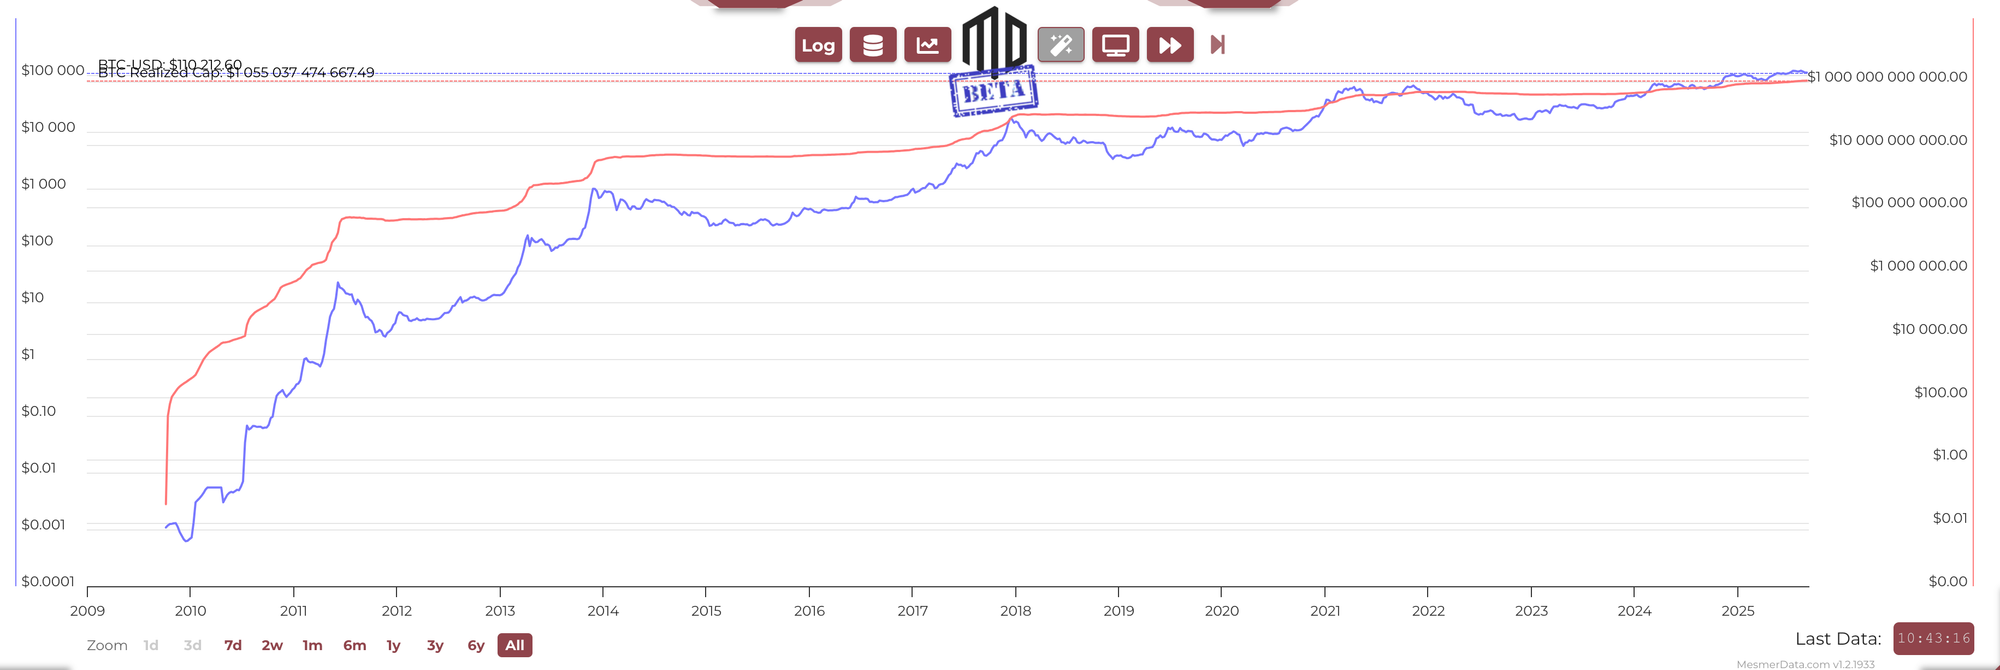
This long history shows the dominance of the up-only drift in Realised Cap across halvings, with shallow pauses during stress and long rises during expansion.
How To Use Realised Cap In Practice
- Confirm advances: favour trends where Realised Cap is rising alongside price.
- Spot accumulation: price ranging while Realised Cap keeps climbing suggests quiet repricing higher beneath the surface.
- Flag distribution: falling or flattening Realised Cap during persistent price strength warns that little new cost basis is forming.
- Build MVRV context: compare Market Cap to Realised Cap (MVRV). Premiums expand in bulls, compress in bears. Use Z-Score to scale extremes.
Common Traps To Avoid
- Treating any single inflection as a trigger. Look for persistence over weeks.
- Ignoring cohort detail. Pair with LTH/STH Realised Price to see who is repricing.
- Reading in isolation. Always cross-check behaviour (SOPR, Realised PnL) and supply activity (Dormancy/CDD).
A Simple Workflow You Can Reuse
- Open Realised Cap and note trend (rising, flat, or slipping).
- Compare with spot price and MVRV / Z-Score.
- Add Market, LTH, STH Realised Price for the cost-basis ladder.
- Check aSOPR and Realised PnL for absorption vs distribution.
- Decide: genuine repricing with support, or a price move running ahead of committed capital.
Mini FAQs
Can realised cap fall?
Yes. It can dip during heavy loss realisation, but extended declines are uncommon. More often it flattens during stress phases.
Why does realised cap move in steps rather than smoothly?
Because coins only “reprice” when they move on-chain. If coins sit still, the cost basis does not update.
How is realised cap different from market cap?
Market cap is today’s spot price multiplied by supply. Realised cap uses each coin’s last-moved price, so it reflects what holders actually paid.
What does rising realised cap usually suggest?
That the network is forming new cost basis at higher prices… demand is absorbing supply rather than only pushing price via short-term flows.
What does a rally with flat realised cap imply?
It can imply price is running ahead of committed capital. Treat it as a caution flag and confirm with behaviour and flows.
What should confirm a realised cap read?
Use MVRV for premium context, realised price bands for the cost-basis ladder, and SOPR or realised profit and loss to see whether spending is profit-taking or stress.
How often should realised cap be checked?
Weekly is usually enough for most readers.
If this helped you anchor valuation to committed capital, Alpha Insider members can access deeper Bitcoin on-chain analysis and commentary here.
Alpha Insider members get:
➡️ Kairos timing windows to plan entries before the crowd moves
➡️ A full DCA Targets page with levels mapped for this cycle
➡️ Exclusive member videos breaking down charts in clear, simple terms
➡️ A private Telegram community where conviction is shared daily
Legal And Risk Notice
This content is for education only and does not constitute financial advice. Crypto assets are volatile and you can lose money. Always do your own research and consider your risk tolerance.


Discussion