


Net liquidity… what it is and why it matters
“Net liquidity” is a simple lens many traders use to proxy dollar availability for risk assets. A common rough cut is: Fed Balance Sheet − TGA − RRP.
- WALCL rises… the Fed is adding assets, bank reserves usually swell.
- WTREGEN (TGA) rises… Treasury is parking cash at the Fed, draining reserves.
- RRP rises… cash is leaving banks and money funds are lending to the Fed overnight, also draining reserves.
It’s not a trading signal by itself… but persistent moves shape the backdrop that risk and Bitcoin trade inside.
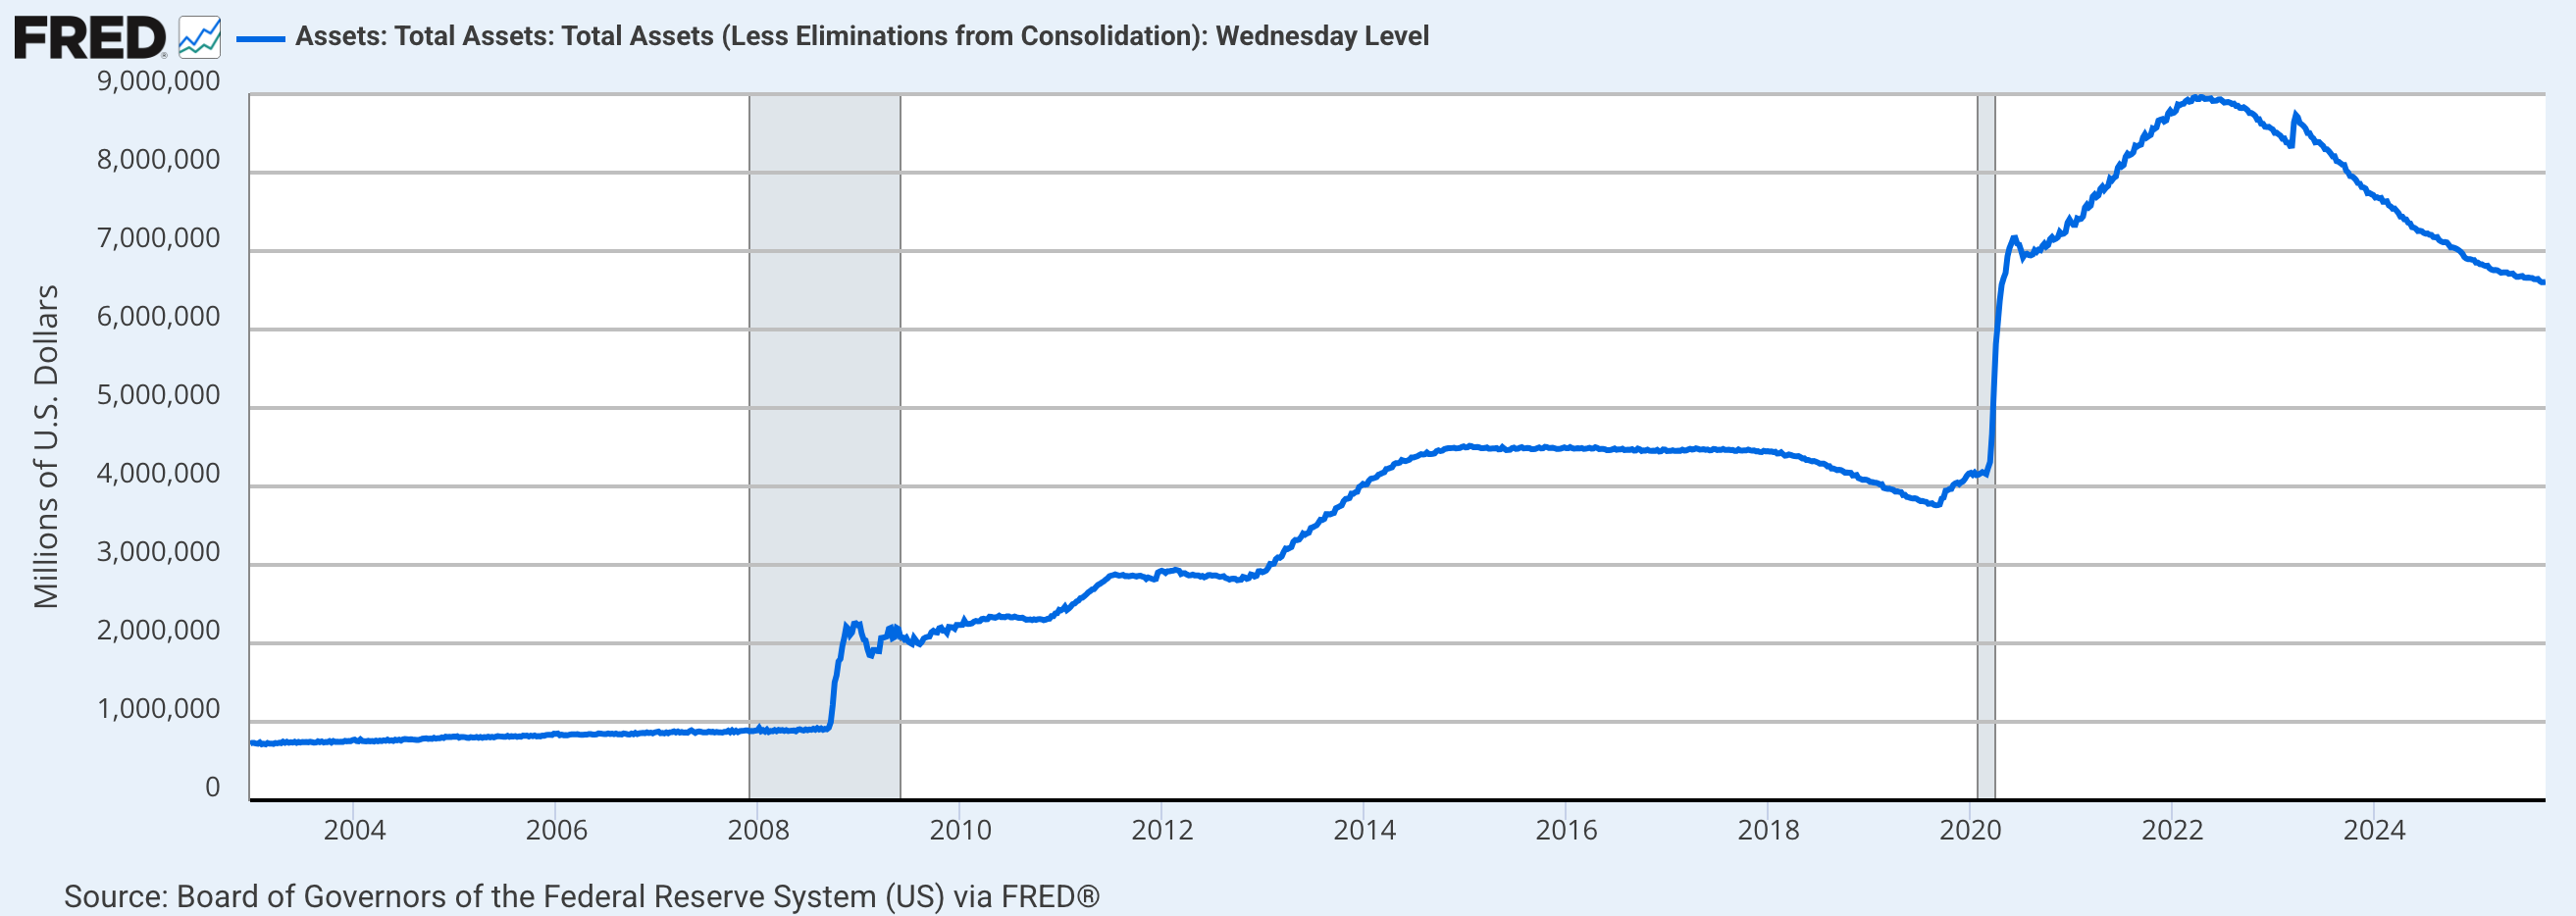
Large step-ups map to QE waves, declines to QT… use the slope and persistence, not one week’s wiggle. Shaded areas indicate U.S. recessions.
TGA… the quiet drain or refill
The Treasury’s General Account is the government’s chequing account at the Fed.
- When TGA builds (e.g., after heavy bill issuance), reserves are pulled from the banking system… liquidity feels tighter.
- When TGA draws down (e.g., outlays exceed receipts), reserves return to banks… easier background.
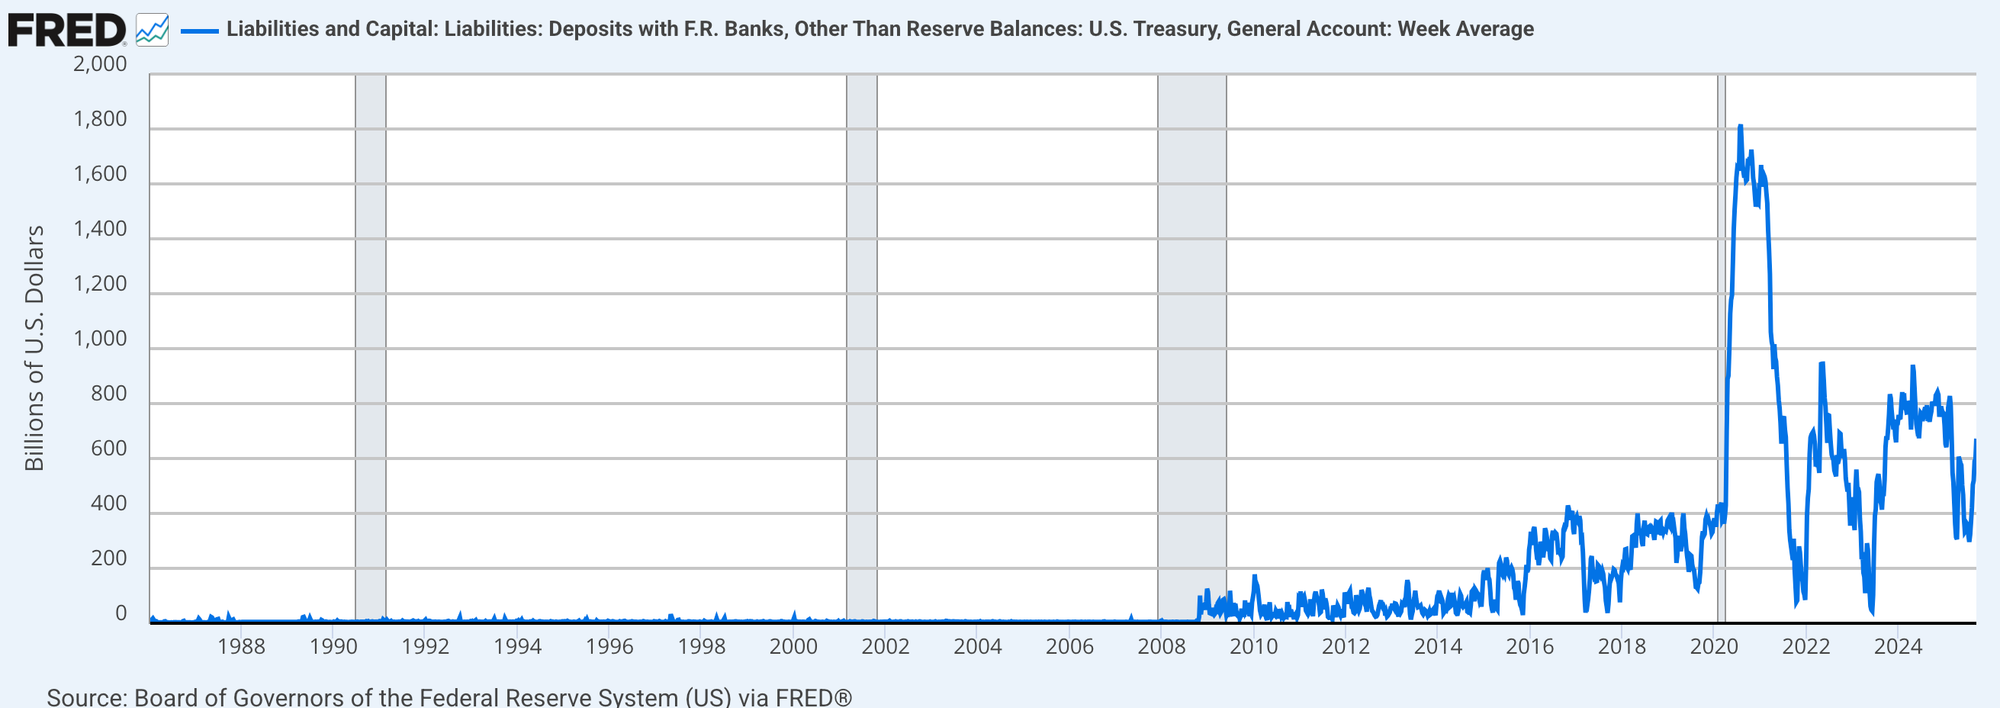
Watch for big post-debt-ceiling rebuilds or pre-quarter-end ramps… they can dominate weekly liquidity tone. Shaded areas indicate U.S. recessions.
RRP… the money-fund pressure valve
Overnight Reverse Repo balances show how much cash money funds park at the Fed against collateral.
- High or rising RRP… cash prefers the Fed over private collateral… reserves are lighter.
- Falling RRP… cash is leaving the Fed facility, often refilling bank reserves or chasing bills.
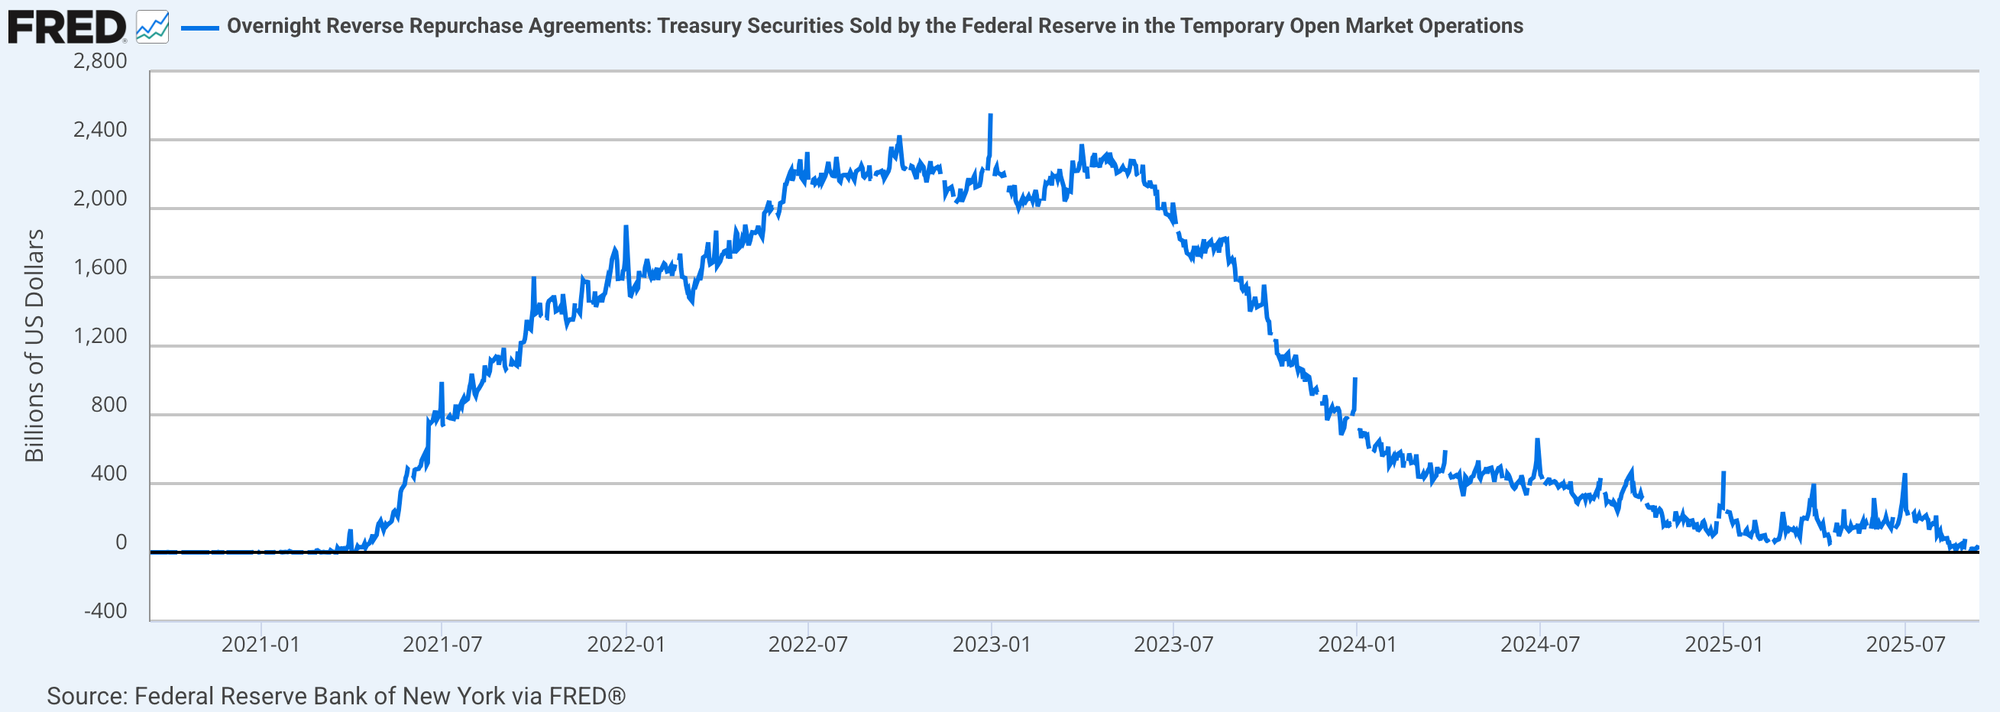
The 2021–2023 surge reflected abundant cash and scarce collateral… the subsequent slide released liquidity back into markets. Shaded areas indicate U.S. recessions.
Putting it together… practical reads
Guide rails… use with trend and other dials.
- WALCL up, TGA down, RRP down… broad easing impulse… better air for beta and Bitcoin if credit is calm.
- WALCL flat, TGA up, RRP up… twin drains… liquidity tighter, respect risk until one leg reverses.
- WALCL down (QT) but TGA down and RRP down… mixed… liquidity can still improve if the drains ease faster than QT.
- Event weeks (tax dates, bill refills)… expect short, noisy swings… judge the multi-week path.
Simple workflow you can reuse
- Weekly… log the 4-week change in WALCL, WTREGEN, and RRP.
- Classify the regime as net adding or net draining.
- Cross-check HY OAS, DXY, and real 10-year yields… alignment raises conviction.
- For Bitcoin… size up when WALCL is steady to higher while TGA and RRP trend lower… trim when TGA rebuilds and RRP rises together.
Mini FAQs
Is “net liquidity” the same as bank reserves?
No… it’s a proxy. Reserves also move with other factors, but the trio captures much of the big swing.
Why did risk rally while QT was running?
Because TGA and RRP fell… their declines offset QT at times. The blend matters more than one line.
Should I act on daily prints?
Avoid it… use weekly data and look for persistence over 2–4 weeks.
If this helped you read the TGA–Fed–RRP mix without guesswork, join Alpha Insider for Macro Heat dashboards, calendar previews for the next prints, and a weekly positioning watchlist. Fewer mistakes, cleaner execution, more conviction.
The Markets Unplugged members get:
➡️ Kairos timing windows to plan entries before the crowd moves
➡️ A full DCA Targets page with levels mapped for this cycle
➡️ Exclusive member videos breaking down charts in plain English
➡️ A private Telegram community where conviction is shared daily
➡️ A dedicated Macro Analysis page with regularly updated analysis and monthly reports
This isn’t noise… it’s the full playbook.
Legal & Risk Notice
This content is educational and not investment advice. Markets involve risk… do your own research, manage position sizing, and never risk money you cannot afford to lose.


Discussion