Technical analyst and macro researcher at The Markets Unplugged. Creator of KAIROS v6 cycle-timing, the Delta Engine (6-factor weekly BTC signal), the BTC/VIX framework, and the Apex Macro Dashboard. Publishes the Cycle Read every Monday.
This analysis connects directly to two earlier pieces on this site. The BTC/VIX framework that has marked every major fear-driven Bitcoin low since 2020 is here. The January range monthly close analysis with April 30 as the line in the sand is here. This piece adds a third framework to the same picture.
Every time Bitcoin sells off sharply, the 2022 comparison comes out.
The drawdown percentages get lined up. The chart patterns get overlaid. The conclusion is always the same: this looks like 2022 and that means new lows are coming.
I understand why people make the comparison. The magnitude of the drawdown from the 2025 highs has been significant. Sentiment has been poor. The macro environment has been uncertain. On the surface, if you are only looking at price action and percentage moves, there are things that superficially resemble the 2022 structure.
But when you look at the volume profile, the structural case for the 2022 comparison falls apart.
This is the framework behind why, and what the current volume profile is actually showing.
What Volume Profile Analysis Is and Why It Matters
Most price charts show volume as a bar at the bottom of the screen representing how much was traded in each time period. A daily bar shows volume for that day. A monthly bar shows volume for that month.
Volume profile does something different. Instead of showing volume over time, it shows volume by price level. The result is a horizontal histogram that reveals where the most significant buying and selling occurred across a specific range.
This matters because markets have memory. The price levels where large amounts of volume were transacted become anchored reference points. When price returns to those levels, the participants who traded there remember them and react. Buyers who established positions at a level defend it when price returns. Sellers who distributed at a level use it as reference for the next distribution. The levels become self-reinforcing precisely because enough capital was deployed there to make them meaningful.
The three primary reference points in any volume profile are:
The Point of Control (POC): The single price level where the most volume was traded across the entire range. The most significant level of all. Markets have a gravitational pull toward the POC when they are in equilibrium.
The Value Area High (VAH): The upper boundary of the price range where approximately 70 percent of all volume was transacted. Above this level is considered premium. Prices above the VAH tend to attract selling as participants consider the asset expensive relative to where most trading occurred.
The Value Area Low (VAL): The lower boundary of the same 70 percent volume range. Below this level is considered discount. Prices below the VAL tend to attract buying as participants consider the asset cheap relative to where most trading occurred.
Between these reference points are High Volume Nodes (HVN), price levels where significant concentrations of volume traded. These levels act as magnets and as support or resistance depending on where price is approaching them from.
The 2022 Volume Profile: What It Actually Showed
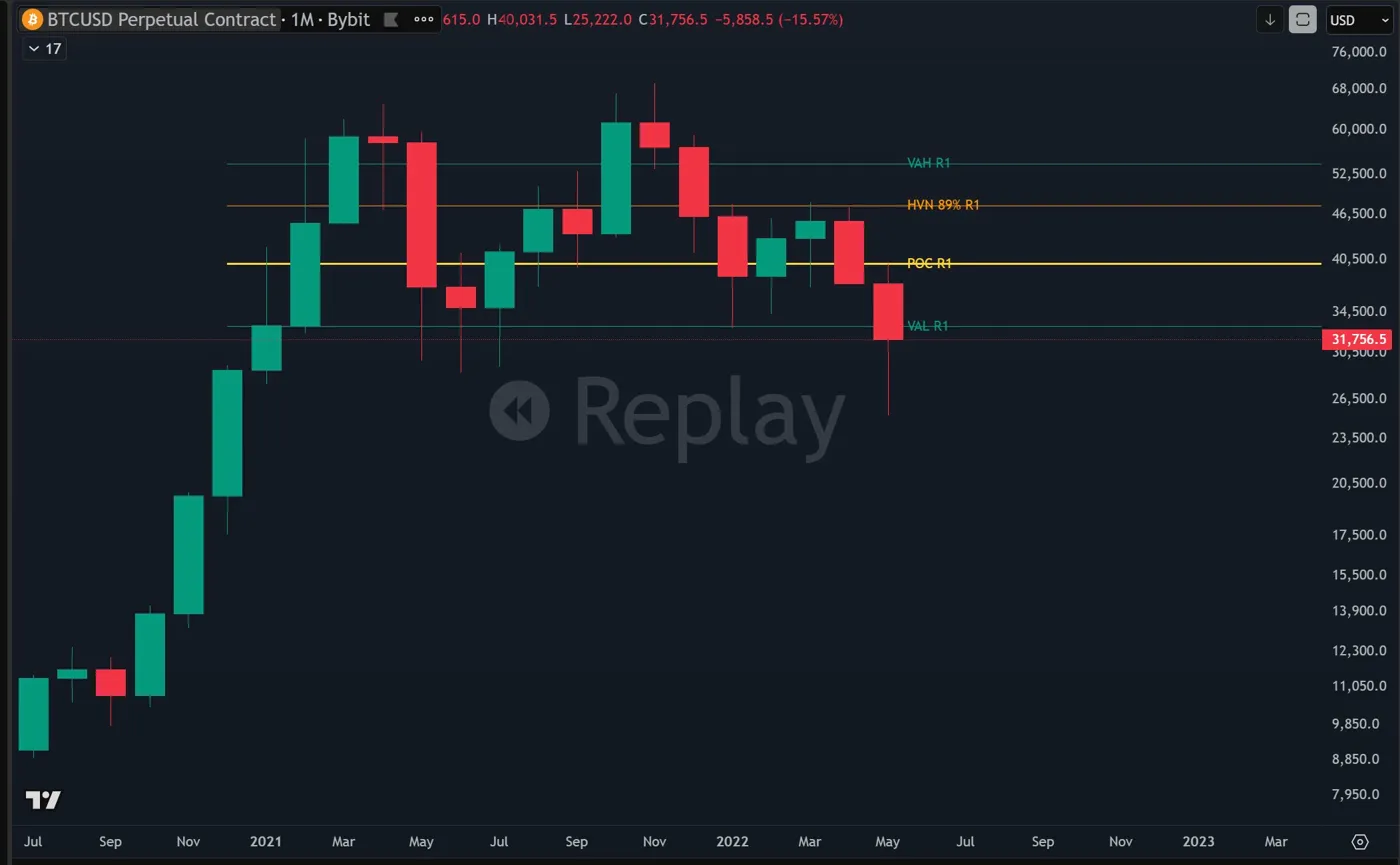
When you apply a volume profile to the 2020 to 2022 Bitcoin cycle and look at what was happening during the bear market, a clear structure emerges.
Bitcoin in 2022 was finding resistance at high volume nodes on the way down. Every bounce into an HVN was sold. Price would rally into a significant volume level, stall, and then roll over to make new lows. The HVN 89% level around $46,500 acted as resistance multiple times during the bear market decline. The POC around $40,500 was broken and became resistance rather than support. The VAL around $32,000 was eventually broken decisively.
This is distribution behaviour. When volume nodes that should act as support instead act as resistance, it tells you the selling pressure is strong enough to overcome the natural buying that occurs at those levels. The market is using the volume nodes as exit points not entry points.
The eventual low in 2022 came well below the VAL of that range, around $15,000 to $16,000, far below the value area entirely. By the time price reached the low, it had broken through every meaningful volume reference in the range.
2022 replay volume profile chart
The Current 2026 Volume Profile: A Different Structure
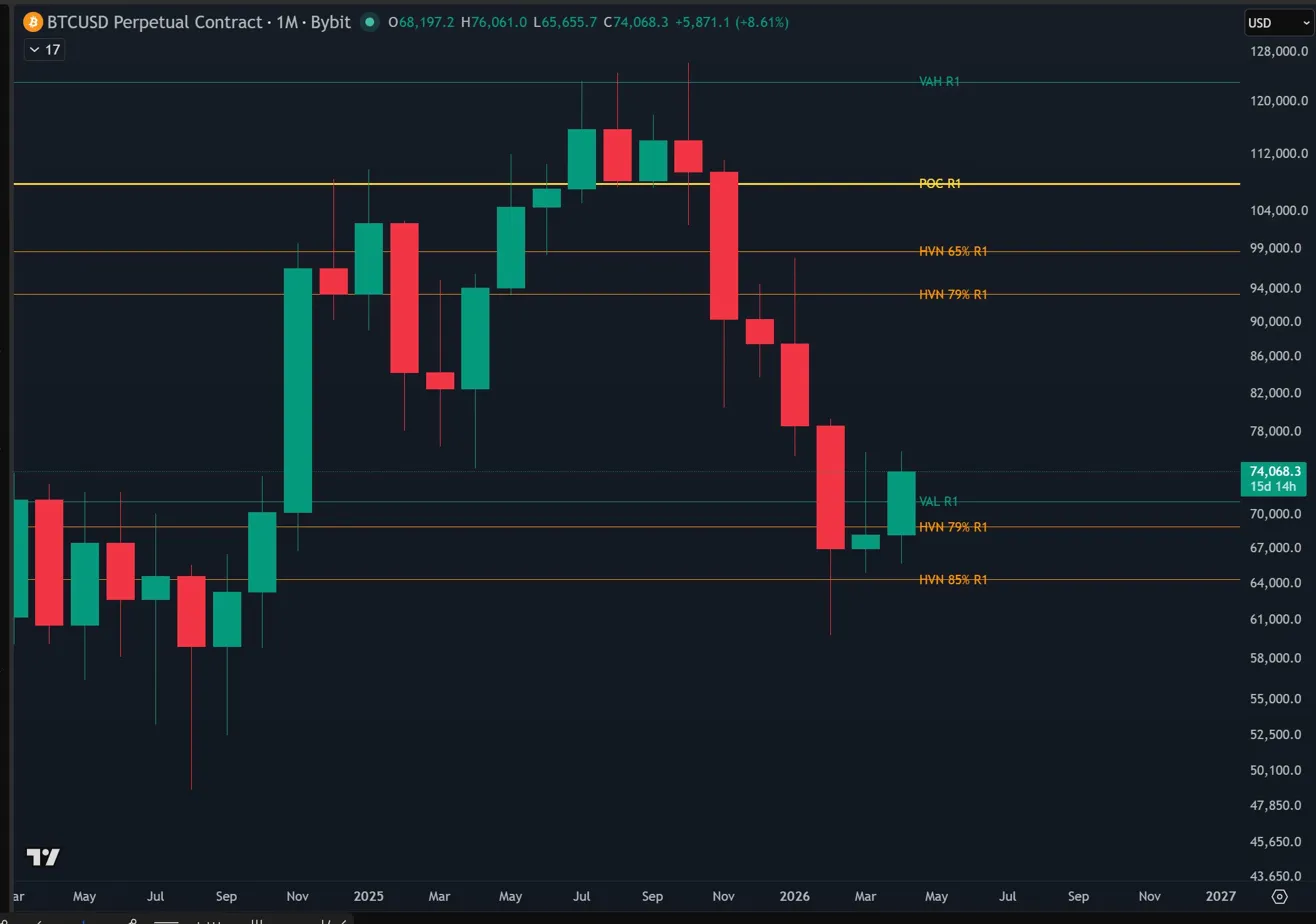
Now look at the current setup with a volume profile applied to the 2024 to 2026 range.
The key levels from this range are:
VAH R1: approximately $123,400
POC R1: approximately $108,000
HVN 65% R1: approximately $98,300
HVN 79% R1: approximately $94,000
VAL R1: approximately $71,600
HVN 79% lower: approximately $68,000
HVN 85% R1: approximately $64,000
Here is what actually happened in Feb 2026.
Bitcoin's monthly wick reached approximately $60,000, breaking below the HVN 85% at $64,000 intraday. That is a significant move. It flushed stops, created maximum fear, and triggered the kind of sentiment that produces "new lows incoming" posts across every social media platform.
The monthly close told a completely different story. March closed at approximately $67,000, recovering back above the HVN 85% at $64,000. The close sits between the HVN 85% at $64,000 and the HVN 79% lower at $68,000, outside the value area but above the critical 85% level.
A wick through a significant volume node that closes back above it is not a breakdown. It is a test. And when that test comes on a monthly candle with a dramatic recovery from $60,000 to $67,000, it is historically a signal of selling exhaustion at that level rather than the beginning of a sustained move lower.
current 2024 to 2026 volume profile chart
This is structurally different from 2022 in a critical way.
In 2022 Bitcoin was closing monthly candles below volume nodes and those nodes were becoming resistance on bounces. Price was breaking through value area boundaries decisively and not recovering. The VAL, the POC, the HVNs — each one fell and stayed fallen.
In the current 2026 setup Bitcoin has wicked aggressively through the HVN 85% and closed back above it. It is attempting to reclaim the value area from below rather than failing at volume nodes from above. Those are opposite market behaviours.
Why the Comparison Fails Structurally
The people making the 2022 comparison are typically doing one of two things.
The first is comparing percentage drawdowns. Yes, the drawdown from the 2025 highs to the 2026 lows is significant in percentage terms. But percentage drawdowns do not tell you about market structure. Bitcoin has had multiple 30 to 50 percent corrections within bull markets that looked alarming on a percentage basis but resolved as corrections rather than cycle-ending bear markets.
The second is overlaying price charts visually. If you squint at certain chart patterns, things can look similar across different time periods. But visual similarity without structural confirmation is not analysis. It is pattern matching without context.
The volume profile provides the context. And the context says the current structure does not match 2022.
In 2022 the volume nodes were acting as resistance on the way down. In 2026 the Feb monthly close recovered above the HVN 85% after a dramatic wick through it. Price was breaking through value area boundaries in 2022 and staying below them. In 2026 price is attempting to reclaim the value area from outside its lower boundary.
Those are opposite structures, not similar ones.
The Three Signal Confluence
This volume profile analysis does not exist in isolation. It is the third independent framework pointing toward the same structural conclusion as two earlier pieces published on this site.
The BTC/VIX ratio touched its long-term trendline support in February 2026, the same signal that has marked every major fear-driven Bitcoin low since 2020 including COVID, the SVB crisis, the yen carry trade unwind, and the April 2025 tariff wars. Full analysis here.
The January 2026 monthly close range was broken in February, only the second time in Bitcoin's history this has occurred. April 30 is the line in the sand for whether this follows the COVID anomaly pattern or the historical bear market pattern. Full analysis here.
Now the volume profile adds a third lens. Bitcoin wicking to $60,000 intraday but closing the Feb monthly candle at $67,000 above the HVN 85% is not the 2022 structure. It is a market testing a critical volume level, finding no genuine sellers willing to take price lower on a closing basis, and recovering. That is the behaviour of a market at or near a structural low, not a market in the early stages of a sustained breakdown.
Three independent frameworks. Three different methodologies. All pointing toward the same structural read.
For cycle structure context, the Pi Cycle Top indicator provides a fourth lens. It tracks where Bitcoin stands relative to a completed cycle top using the 111DMA and 350DMA x2. Members can read the current Pi Cycle Top read here.
The section below covers the specific volume levels and what each one means for the current setup, including the invalidation scenario and what a monthly close below key levels would change. This section is available to Alpha Lite and Alpha Insider members. Join here.
Technical analyst and macro researcher at The Markets Unplugged. Creator of KAIROS v6 cycle-timing, the Delta Engine (6-factor weekly BTC signal), the BTC/VIX framework, and the Apex Macro Dashboard. Publishes the Cycle Read every Monday.
Technical analyst and macro researcher at The Markets Unplugged. Creator of KAIROS v6 cycle-timing, the Delta Engine (6-factor weekly BTC signal), the BTC/VIX framework, and the Apex Macro Dashboard. Publishes the Cycle Read every Monday.
Technical analyst and macro researcher at The Markets Unplugged. Creator of KAIROS v6 cycle-timing, the Delta Engine (6-factor weekly BTC signal), the BTC/VIX framework, and the Apex Macro Dashboard. Publishes the Cycle Read every Monday.
Technical analyst and macro researcher at The Markets Unplugged. Creator of KAIROS v6 cycle-timing, the Delta Engine (6-factor weekly BTC signal), the BTC/VIX framework, and the Apex Macro Dashboard. Publishes the Cycle Read every Monday.
Technical analyst and macro researcher at The Markets Unplugged. Creator of KAIROS v6 cycle-timing, the Delta Engine (6-factor weekly BTC signal), the BTC/VIX framework, and the Apex Macro Dashboard. Publishes the Cycle Read every Monday.
Technical analyst and macro researcher at The Markets Unplugged. Creator of KAIROS v6 cycle-timing, the Delta Engine (6-factor weekly BTC signal), the BTC/VIX framework, and the Apex Macro Dashboard. Publishes the Cycle Read every Monday.
Technical analyst and macro researcher at The Markets Unplugged. Creator of KAIROS v6 cycle-timing, the Delta Engine (6-factor weekly BTC signal), the BTC/VIX framework, and the Apex Macro Dashboard. Publishes the Cycle Read every Monday.
Technical analyst and macro researcher at The Markets Unplugged. Creator of KAIROS v6 cycle-timing, the Delta Engine (6-factor weekly BTC signal), the BTC/VIX framework, and the Apex Macro Dashboard. Publishes the Cycle Read every Monday.
Technical analyst and macro researcher at The Markets Unplugged. Creator of KAIROS v6 cycle-timing, the Delta Engine (6-factor weekly BTC signal), the BTC/VIX framework, and the Apex Macro Dashboard. Publishes the Cycle Read every Monday.
Technical analyst and macro researcher at The Markets Unplugged. Creator of KAIROS v6 cycle-timing, the Delta Engine (6-factor weekly BTC signal), the BTC/VIX framework, and the Apex Macro Dashboard. Publishes the Cycle Read every Monday.
Technical analyst and macro researcher at The Markets Unplugged. Creator of KAIROS v6 cycle-timing, the Delta Engine (6-factor weekly BTC signal), the BTC/VIX framework, and the Apex Macro Dashboard. Publishes the Cycle Read every Monday.
Technical analyst and macro researcher at The Markets Unplugged. Creator of KAIROS v6 cycle-timing, the Delta Engine (6-factor weekly BTC signal), the BTC/VIX framework, and the Apex Macro Dashboard. Publishes the Cycle Read every Monday.
Technical analyst and macro researcher at The Markets Unplugged. Creator of KAIROS v6 cycle-timing, the Delta Engine (6-factor weekly BTC signal), the BTC/VIX framework, and the Apex Macro Dashboard. Publishes the Cycle Read every Monday.
Technical analyst and macro researcher at The Markets Unplugged. Creator of KAIROS v6 cycle-timing, the Delta Engine (6-factor weekly BTC signal), the BTC/VIX framework, and the Apex Macro Dashboard. Publishes the Cycle Read every Monday.
Technical analyst and macro researcher at The Markets Unplugged. Creator of KAIROS v6 cycle-timing, the Delta Engine (6-factor weekly BTC signal), the BTC/VIX framework, and the Apex Macro Dashboard. Publishes the Cycle Read every Monday.
Technical analyst and macro researcher at The Markets Unplugged. Creator of KAIROS v6 cycle-timing, the Delta Engine (6-factor weekly BTC signal), the BTC/VIX framework, and the Apex Macro Dashboard. Publishes the Cycle Read every Monday.
Technical analyst and macro researcher at The Markets Unplugged. Creator of KAIROS v6 cycle-timing, the Delta Engine (6-factor weekly BTC signal), the BTC/VIX framework, and the Apex Macro Dashboard. Publishes the Cycle Read every Monday.
Technical analyst and macro researcher at The Markets Unplugged. Creator of KAIROS v6 cycle-timing, the Delta Engine (6-factor weekly BTC signal), the BTC/VIX framework, and the Apex Macro Dashboard. Publishes the Cycle Read every Monday.
Technical analyst and macro researcher at The Markets Unplugged. Creator of KAIROS v6 cycle-timing, the Delta Engine (6-factor weekly BTC signal), the BTC/VIX framework, and the Apex Macro Dashboard. Publishes the Cycle Read every Monday.
Technical analyst and macro researcher at The Markets Unplugged. Creator of KAIROS v6 cycle-timing, the Delta Engine (6-factor weekly BTC signal), the BTC/VIX framework, and the Apex Macro Dashboard. Publishes the Cycle Read every Monday.
Technical analyst and macro researcher at The Markets Unplugged. Creator of KAIROS v6 cycle-timing, the Delta Engine (6-factor weekly BTC signal), the BTC/VIX framework, and the Apex Macro Dashboard. Publishes the Cycle Read every Monday.