


The 2s10s yield curve is the gap between the US 10-year Treasury yield and the 2-year yield. When the curve inverts, the 2-year sits above the 10-year, which often reflects restrictive policy near term or slower growth expectations ahead. When it steepens, the gap widens again, but the driver matters because a bear steepener and a bull steepener have very different implications for risk assets.
Key points
- The 2s10s curve compares near-term policy expectations (2-year) with longer-term growth and inflation expectations (10-year).
- Inversion is a warning signal, not a timing tool… it often precedes recessions, but the lead time varies.
- Steepening can be bullish or bearish depending on whether the move is led by the front end or the long end.
- Pair curve moves with real yields and the dollar to judge whether conditions are tightening or easing.
If you want quick definitions for real yields, breakevens and DXY, see the Crypto Glossary.
What Is the 2s10s Yield Curve?
The 2s10s curve is the gap between the 10-year US Treasury yield and the 2-year yield.
- Inversion means the 2-year is above the 10-year… the market expects tighter policy near term or slower growth ahead.
- Steepening means the gap is rising. Context matters… a bear steepener is long yields up faster than 2s, a bull steepener is 2s down faster than 10s.
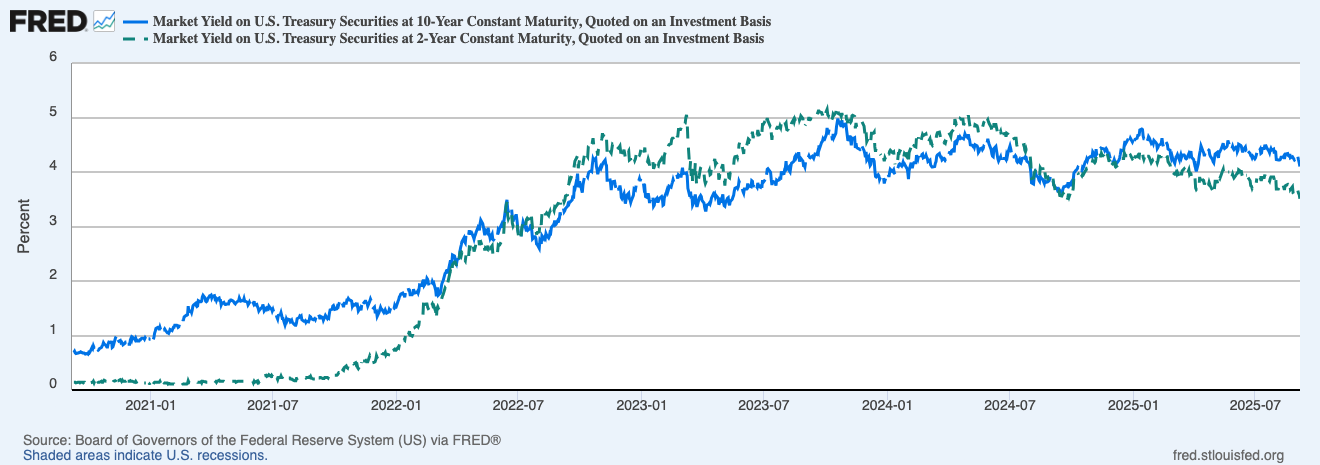
This overlay shows the hiking cycle, the flip into inversion, then the early re-steepening as policy peaks.
Why Inversion Gets So Much Attention
- Growth signal: deep, persistent inversion often precedes recessions by months… not a timer, a warning.
- Policy stance: when 2s sit above 10s, the market says policy is restrictive now relative to the long run.
- Risk assets: inverted curves pair with higher real yields and a firm dollar… crypto beta usually feels that squeeze.
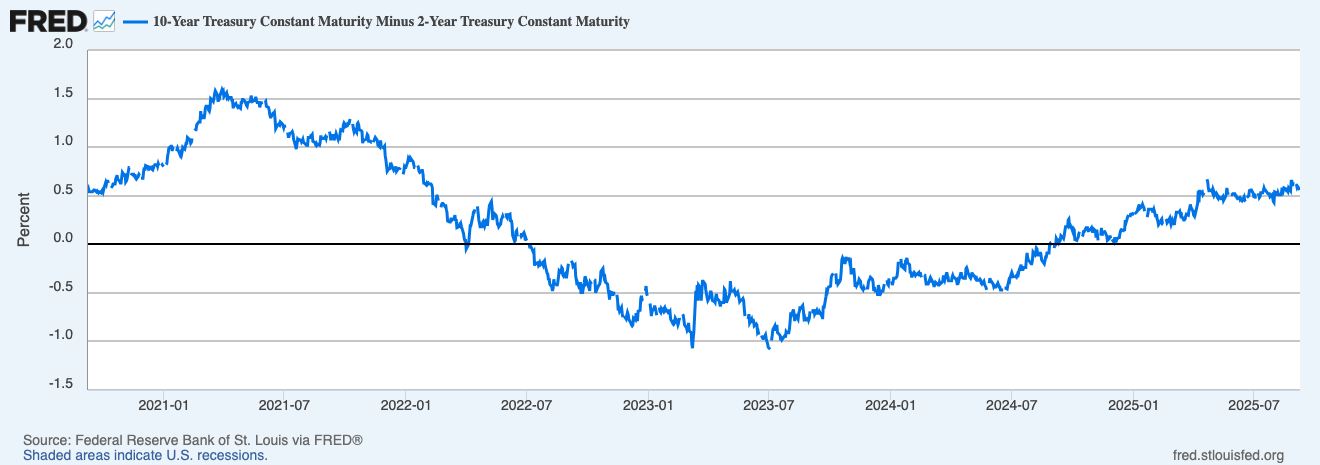
Below zero is inversion. The crawl back toward zero is the early steepener.
Steepener Types… and why they trade differently
- Bear steepener, long end up, often from hotter data or supply pressure… duration sells off, dollar can firm, high-beta assets wobble.
- Bull steepener, front end down, usually when the market prices cuts… dollar softens, duration rallies, beta breathes.
- Mixed moves happen… read the drivers not just the shape.
How to read the setup in practice

- If 10s climb while 2s are sticky, think bear steepener… treat risk with respect.
- If 2s drop while 10s hold, think bull steepener… easier tape for tech and crypto.
- The speed of change matters… fast steepeners bite more than slow drifts.
- Pair curve moves with real yields and DXY to confirm the macro impulse.
Watch-outs
- False dawns: the curve can flirt with de-inversion, then slip back. Look for persistence.
- Event noise: CPI, payrolls and auctions can yank 2s or 10s for a day or two… don’t overreact.
- Supply dynamics: heavy Treasury issuance can push long yields up independent of growth.
- Global spillovers: JGBs, Bunds and oil shifts can nudge the US curve… keep an eye on the cross-asset tape.
A quick workflow you can reuse
- Check the 2s10s spread… inverted, flat, or steepening.
- Open the overlay of 10s vs 2s… is the move front-end or long-end led.
- Cross-check real yields and DXY… macro impulse confirmed or not.
- Map risk: bear steepener… lighten beta or tighten risk; bull steepener… tolerance rises, but still respect levels.
- Into big prints, size down… react, don’t predict.
Mini FAQs
Is inversion a guaranteed recession call.
No. It’s a strong warning, not a date stamp. Use it with growth data and credit spreads.
Which is more important, the level or the change.
Both. Deep, long inversion matters… but the turn into a steepener often moves markets fastest.
What about other curves like 3m-10y.
Useful, often earlier. 2s10s is popular because it captures policy at the front and growth at the back.
If this helped you read the curve without guesswork, join Alpha Insider for Macro Heat dashboards, calendar previews for the next prints, and a weekly positioning watchlist. Fewer mistakes, cleaner execution, more conviction.
The Markets Unplugged members get:
➡️ Kairos timing windows to plan entries before the crowd moves
➡️ A full DCA Targets page with levels mapped for this cycle
➡️ Exclusive member videos breaking down charts in plain English
➡️ A private Telegram community where conviction is shared daily
➡️ A dedicated Macro Analysis page with regularly updated analysis and monthly reports
It’s the full playbook.


Discussion