


Key Points
- Japan’s 10-year yield is already near 2%… the shift from zero rates has been underway for years, not just this week.
- Crypto is already in a sizeable drawdown: Bitcoin has slipped from around 120k to the high-80k area and total market cap has been trending lower for weeks.
- Headlines point to past BoJ hikes that coincided with 20 to 30% Bitcoin drops, but they ignore other drivers and the fact that a similar drawdown has largely happened already.
- The real transmission from the Bank of Japan to crypto runs through global yields, the yen and risk appetite, not a single button marked “crash Bitcoin to 70k”.
- Macro Heat treats BoJ as one line in a bigger dashboard… unless its move lines up with tighter US conditions, a stronger dollar and on-chain stress, it is more likely a leverage reset than a cycle kill switch.
Is The Bank Of Japan About To Crash Crypto?
The short answer is no. The Bank of Japan can nudge global bond yields higher and shake yen-funded carry trades, which in turn can tighten risk conditions for a while. That is enough to trigger a sharp flush in a leveraged market… but it does not give Japan a direct stop button for Bitcoin or the wider crypto cycle.
Today’s fear is anchored on a familiar pattern. After rate hikes in March 2024, July 2024 and January 2025, Bitcoin saw drawdowns of roughly 20 to 30%. Commentators have chained those moves together and concluded that “every BoJ hike knocks 20 to 30% off BTC”… then projected the same again around this week’s meeting, with targets in the 65k to 70k range.
Correlation is not a trading plan. To understand what this week really means, you need to look at where Japanese yields sit now, how crypto has already behaved into the meeting, and how BoJ fits inside the wider Macro Heat picture.
What Japan’s Bond Chart Actually Shows
The first thing to note is that Japan’s 10-year yield is no longer pinned at zero. The move from ultra-low levels has been building since 2021 and has accelerated over the last two years. The latest print is close to 1.99%, the highest level in many years.
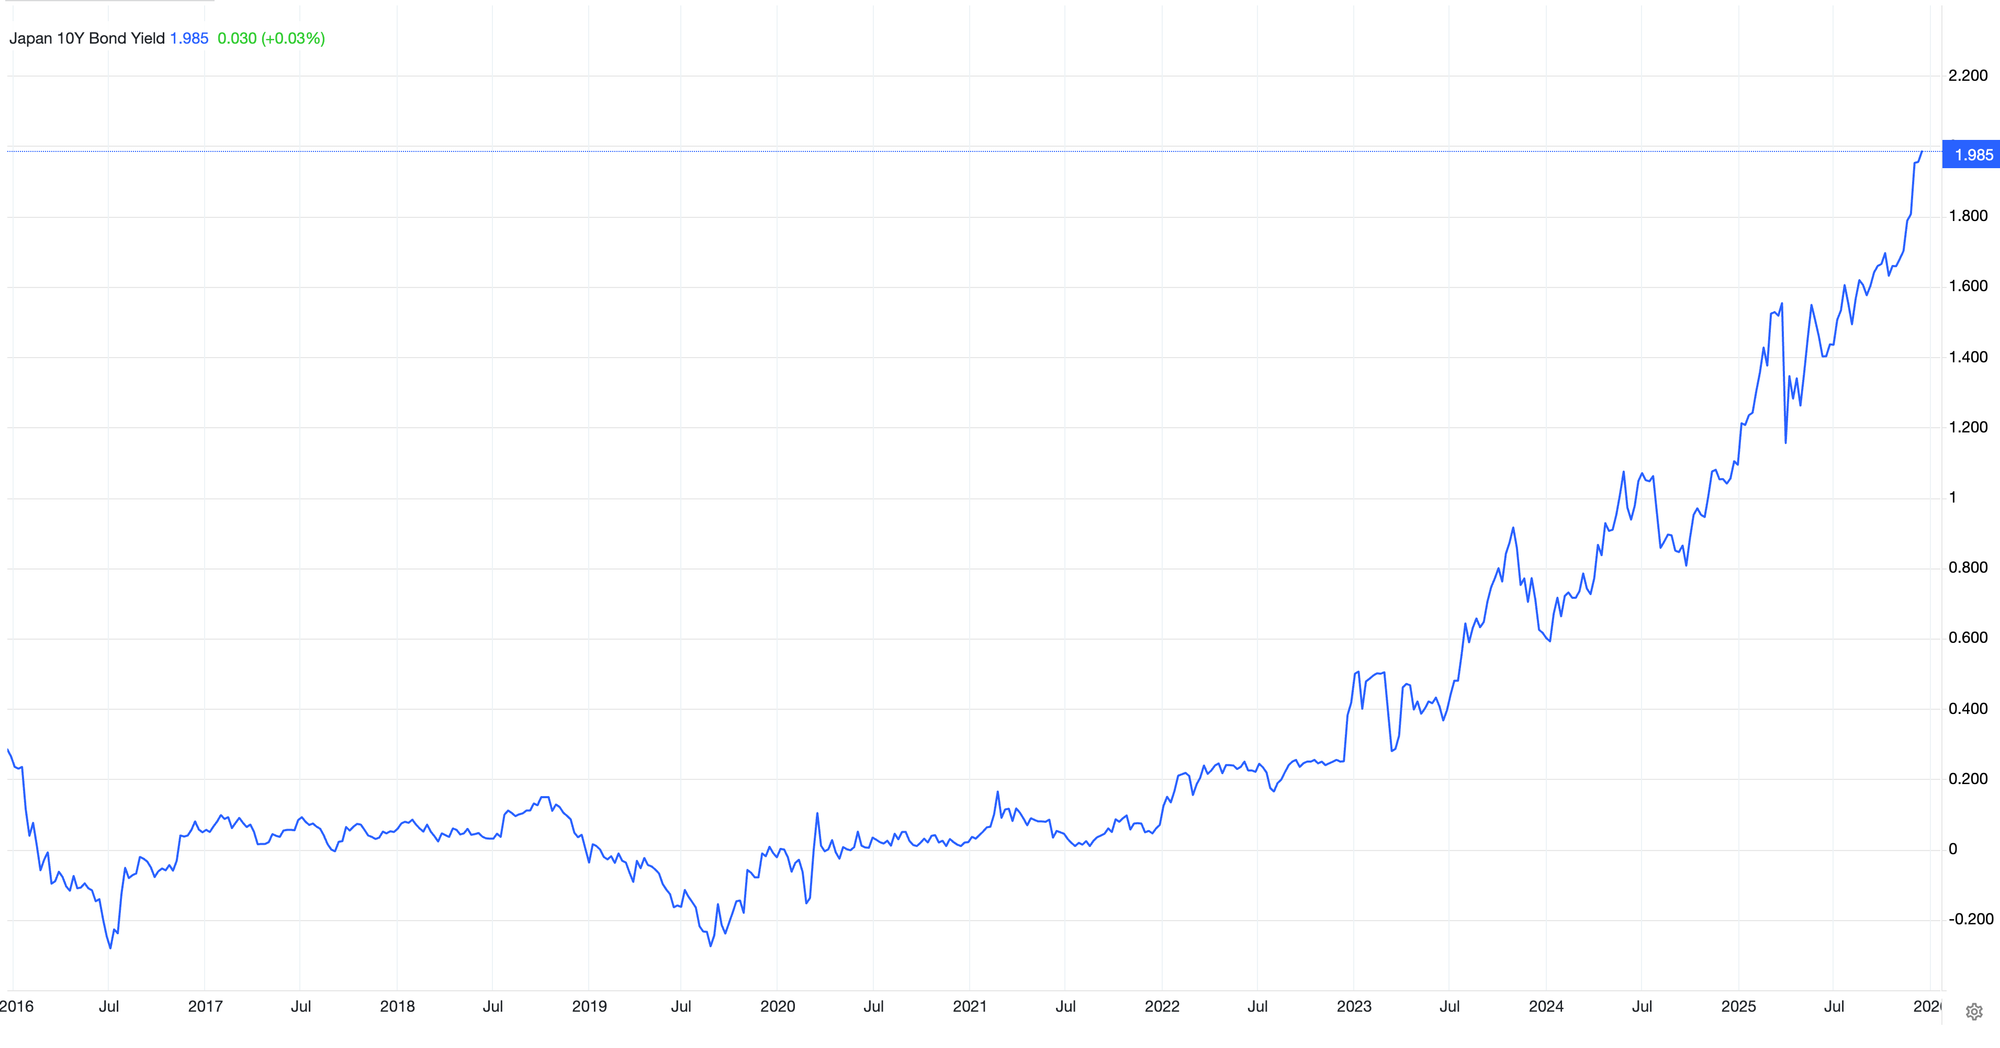
This chart shows the 10-year yield grinding sideways near zero for most of 2016 to 2021, then breaking higher and trending up towards 2% into late 2025. The “Japan is finally waking up” story has been in play for some time… the market is not discovering it for the first time this week.
Zooming in on 2025 makes the point even clearer. The yield has spent the year stepping higher, with bumps around prior meetings… yet the current level is an extension of that path, not a sudden spike from nowhere.
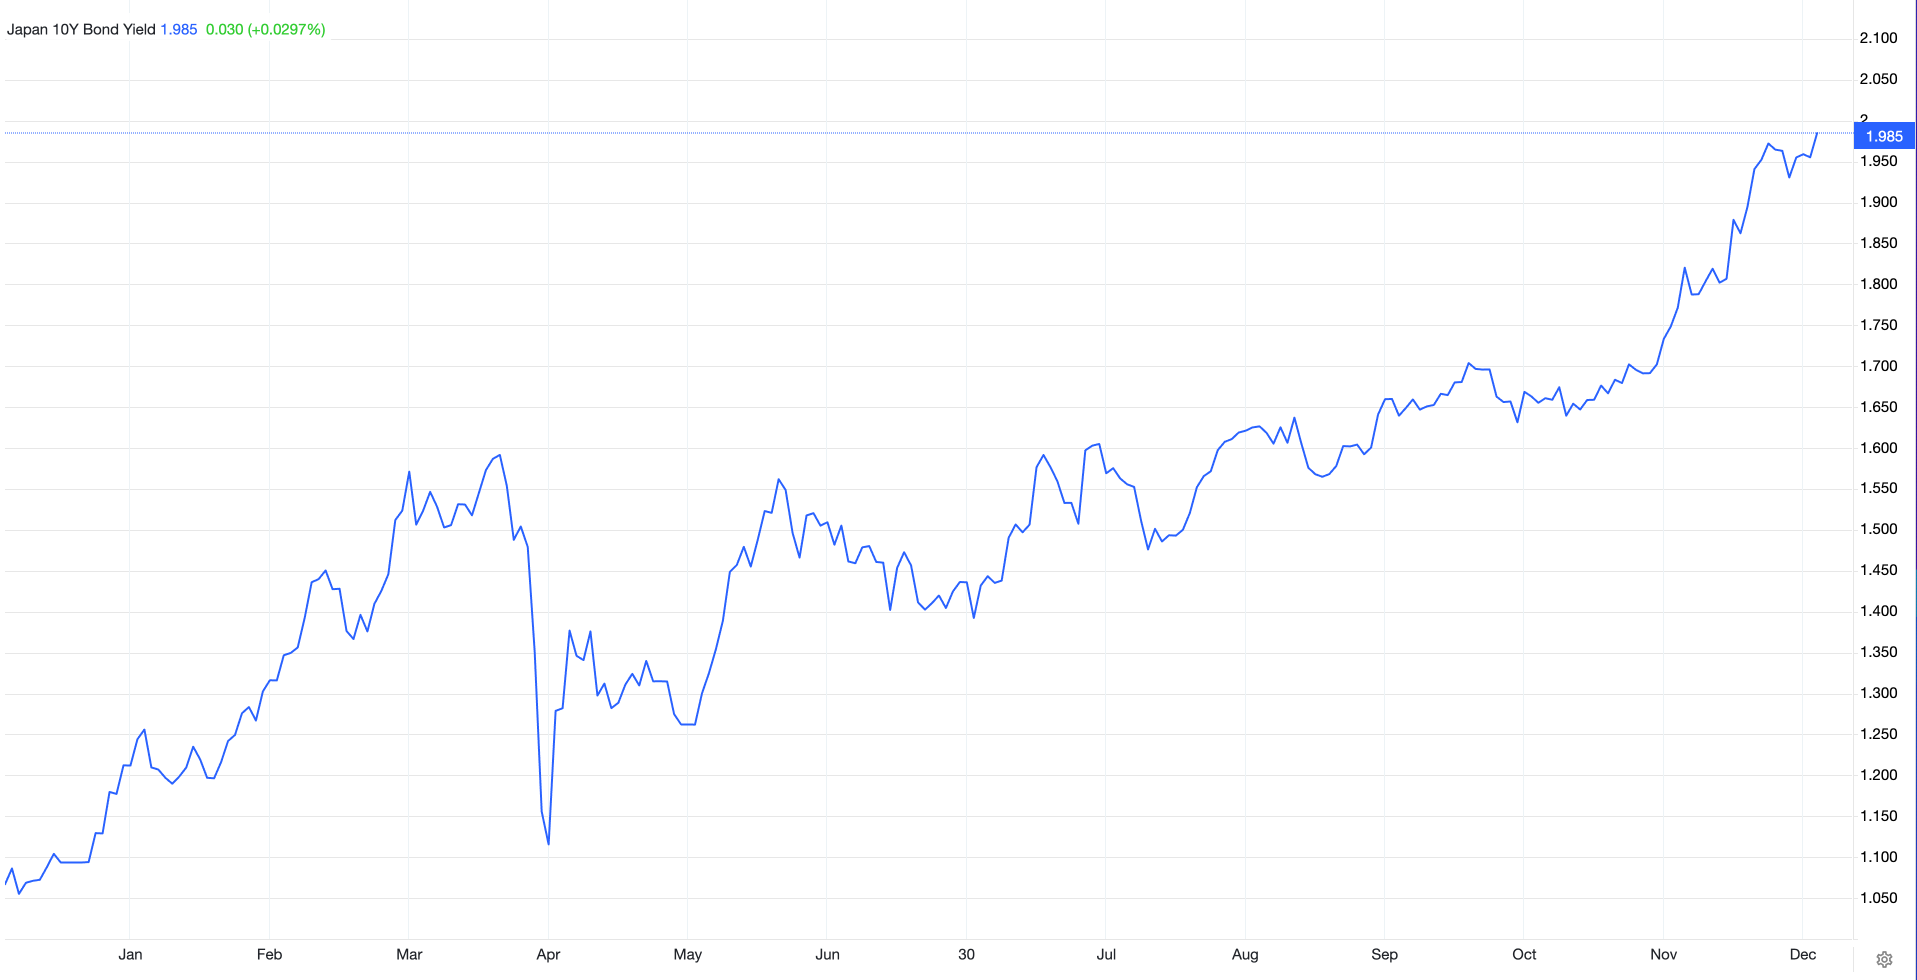
The yield has climbed steadily from around 1.0% at the start of the year to almost 2.0% ahead of the December meeting, with pullbacks along the way. The trend is higher, but much of the “normalisation” has already been priced into Japanese bonds.
When you read that a hike to 0.75% will be “the highest in twenty years”, the phrase sounds dramatic. On a chart, it is a continuation of a process the market has been digesting for several quarters.
Crypto Was Already Correcting Before This Meeting
Now look at crypto itself. Total market cap and Bitcoin were not making fresh highs into this event… they were already in a structured drawdown.
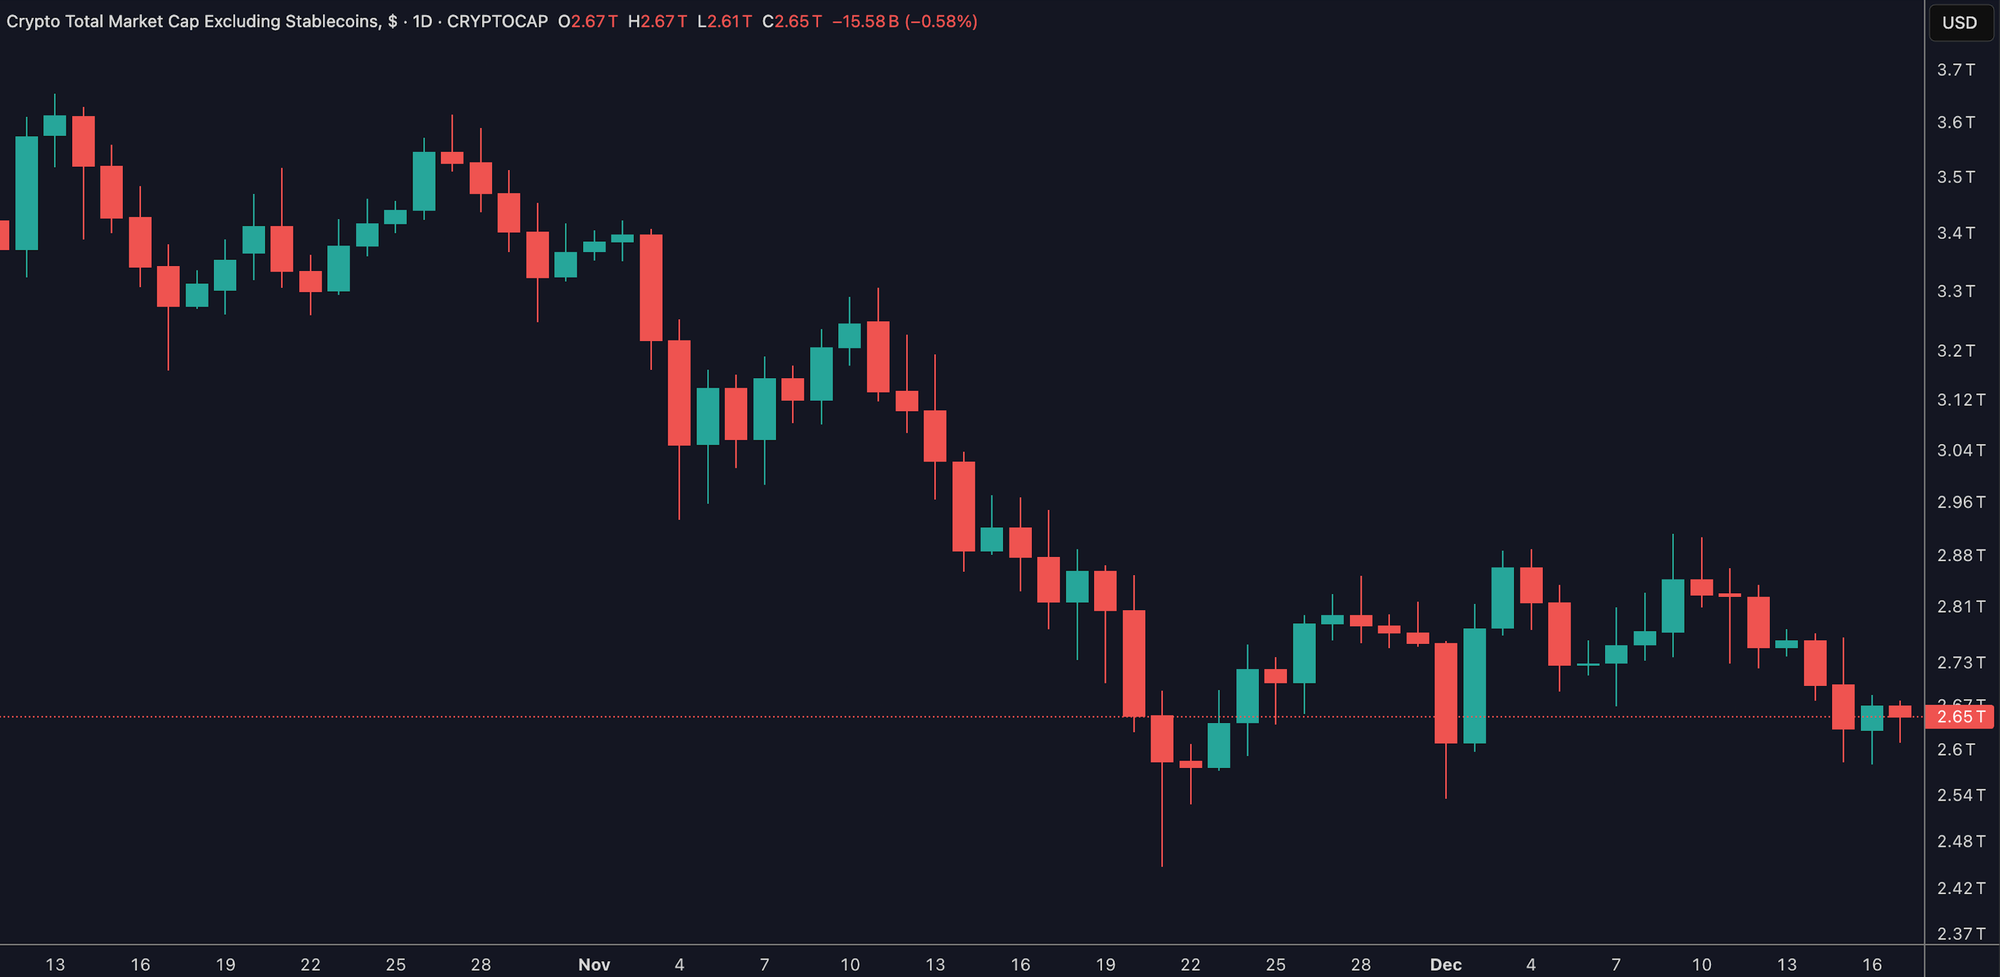
This chart shows the market cap of crypto, excluding stablecoins, sliding from the mid-3 trillion region down towards 2.65 trillion over the last two months. The move is a clear series of lower highs and lower lows… a correction was underway long before this week’s headlines.
On the full market cap view, including stablecoins, the pattern is similar. The market has eased from above 3.3 trillion to just under 3.0 trillion, with persistent selling pressure rather than a single cliff edge.
Bitcoin tells the same story in price terms.
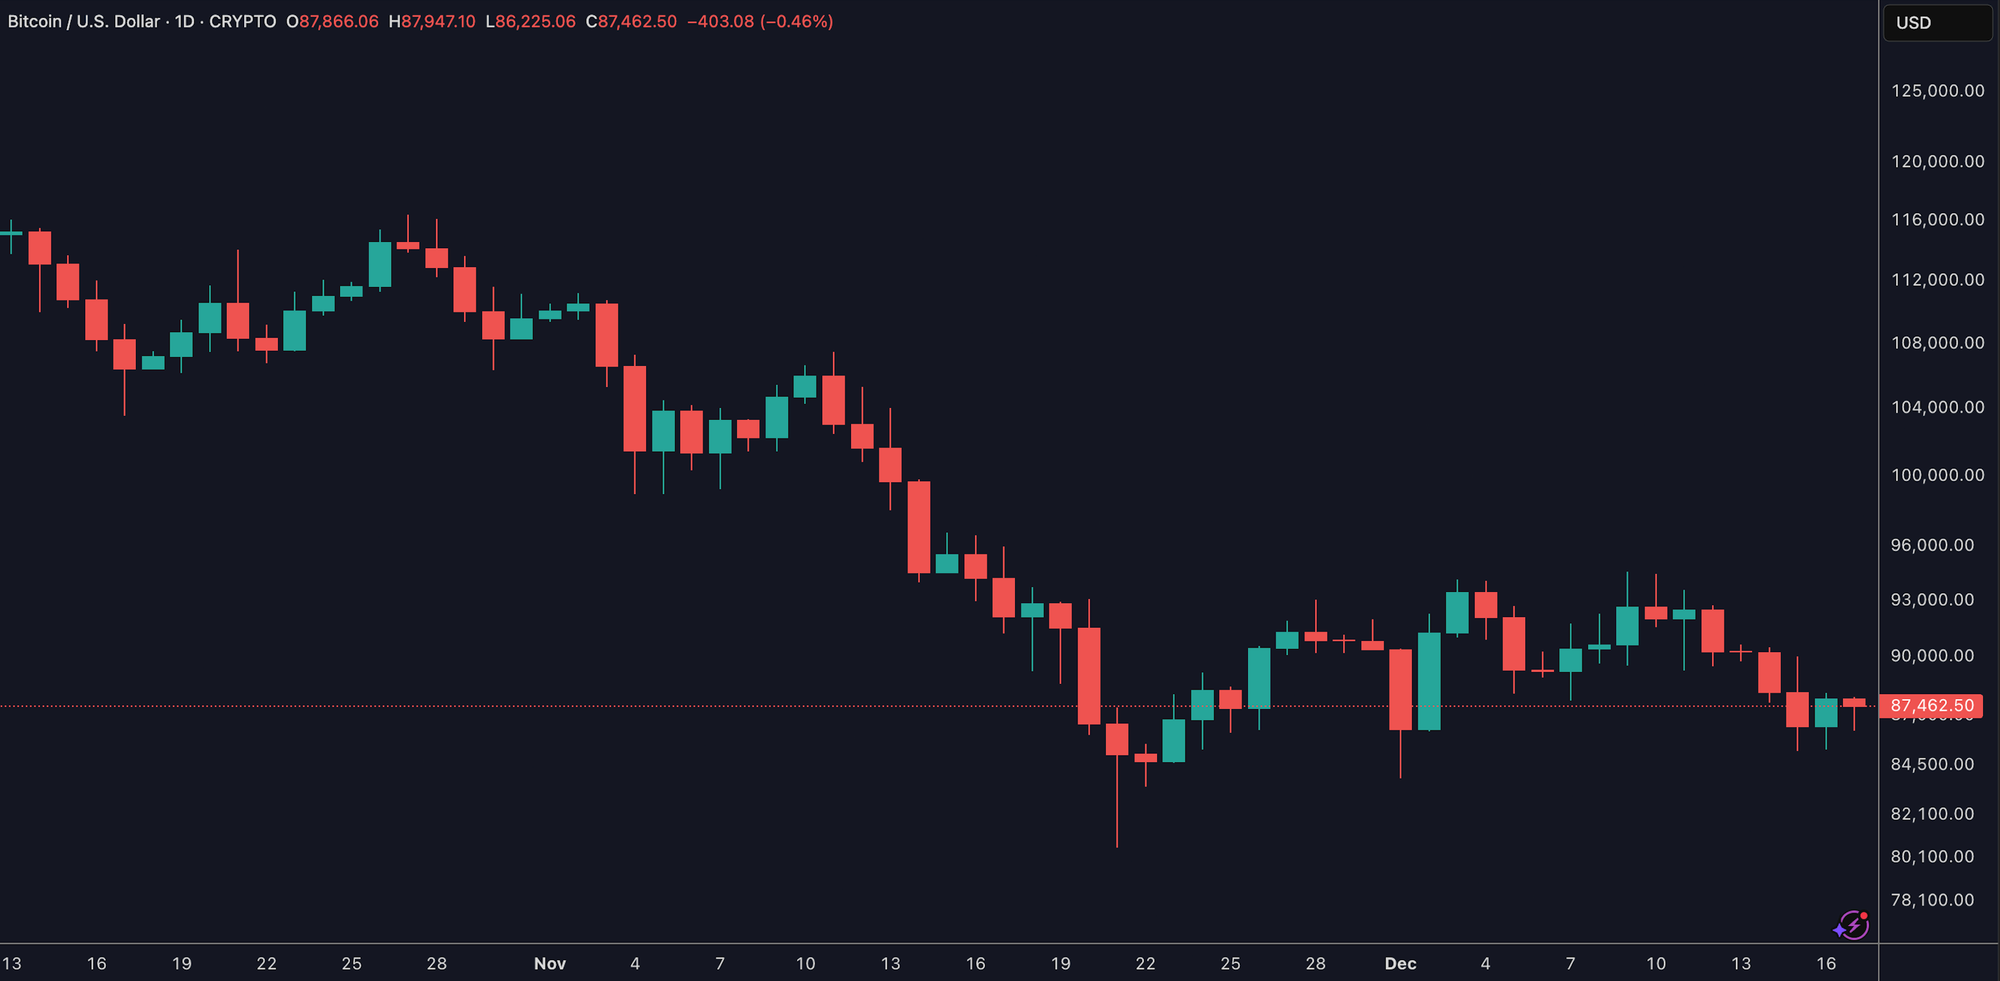
After peaking near 120k, Bitcoin has worked its way down into the high-80k zone. That is already a drawdown on the order of 25 to 30%. In other words… the magnitude that some analysts associate with “what happens after a BoJ hike” has largely taken place before the December meeting.
When a market has already moved, a widely telegraphed catalyst often acts as confirmation rather than the start of a fresh leg. The BoJ decision can still cause volatility, but it is arriving into an environment that has already de-risked to a degree.
The “Japan Bank Crypto Crash” Narrative
The current scare rests on a simple story:
- Japan has been the world’s cheap funding hub.
- As Japanese rates rise, yen-funded carry trades unwind.
- Global risk assets, including Bitcoin, lose a key source of leverage and fall sharply.
There is some truth in the carry-trade mechanism. As funding costs rise from near-zero, borrowing in yen to buy higher-yielding assets becomes less attractive, and positions have to be adjusted. The issue is one of scale and timing.
Most retail crypto participants are not directly funding longs from yen loans. The transmission runs through funds and institutions that hold a wide range of assets. They do not yeet Bitcoin first and figure out everything else later… they reduce risk across the board, guided by risk models and liquidity needs.
The three drawdowns often cited around past BoJ hikes were not driven solely by Japan. They took place in a broader context that included US yield repricing, changes in dollar liquidity, shifts in ETF flows and on-chain dynamics. Repeating the percentage numbers without that context is more marketing than analysis.
Where The Bank Of Japan Sits In Macro Heat
In Macro Heat we do not treat the Bank of Japan as a special villain. It is one actor inside a wider macro matrix that includes:
- US policy rates and the Treasury curve
- Inflation trends
- The US dollar index
- Global equity indices and credit spreads
- Liquidity measures and funding costs
Japan sits mainly in the rates and FX quadrant. We watch how 10-year JGB yields move relative to US and European yields, and how the yen trades against the dollar. A modest step higher in Japanese yields that is widely anticipated and roughly matched by moves elsewhere is a very different signal from a shock move that drags global yields up and tightens conditions aggressively.
For Bitcoin and altcoins, the question is always… is BoJ signalling a genuine turn in the global rate regime, or is it one more step along a path the market knows already.
How To Read This BoJ Hike For Bitcoin And Crypto
Putting all of this together, here is a simple framework for reading the coming decision.
- Look at what is new.
Japan’s 10-year yield is near 2% because policy has been shifting for several years. A hike that takes the policy rate to 0.75% is part of that journey. The element that matters is whether guidance and future plans hint at a more aggressive tightening path than markets expect. - Check the global response, not just the headline.
Watch US yields, the dollar and global equities in the days after the meeting. If US yields spike, the dollar strengthens and equity indices break key levels, then we are dealing with a broader risk-off phase. If they wobble then stabilise, the odds favour a digestion move rather than a new macro regime. - Overlay on-chain and positioning.
Bitcoin has already fallen around 25 to 30% from its high. If on-chain metrics still show accumulation and derivatives data suggest forced liquidations rather than fresh shorting, a further overshoot is likely to be a buying opportunity for patient capital. If, instead, you see long-term holders distributing and open interest building into strength after the meeting, the risk profile changes. - Respect the path already travelled.
Total crypto market cap has been trending lower for weeks. A mechanical “another 30% down because that is what happened last time” ignores this path. In cycles, the percentage decline is one thing; where you start counting from is another.
What The Market Is Getting Wrong About This BoJ Scare

A few misunderstandings are driving the current tone.
- Treating a conditional pattern as a rule.
Three drawdowns that happened to follow BoJ hikes do not guarantee a fourth of the same size. Each took place in a different macro context and crypto setup. - Ignoring how much is already priced.
Japan’s yields are near multi-year highs and crypto is already correcting. The meeting may add volatility, but it is unlikely to be a pure “surprise shock” unless the Bank of Japan goes far beyond expectations. - Overstating Japan and understating the United States.
For Bitcoin, US dollar liquidity and US policy are still the primary macro anchors. Japan matters, but it is downstream from the main tap. - Framing everything as a crash.
A deep correction inside a multi-year cycle is painful… but not the same as a structural break. The job is to work out which one you are living through, not to assume the worst because a central bank meeting is on the calendar.
Mini FAQs
Does the Bank of Japan control Bitcoin’s price?
No. Its decisions can influence global yields, the yen and risk appetite, but Bitcoin’s price is driven by a wider mix of factors including US policy, ETF flows, adoption and on-chain positioning.
Why are analysts calling for a 20 to 30% Bitcoin crash on this hike?
Because previous hikes roughly coincided with drawdowns of that size. Those moves happened in specific macro contexts and from different starting points. Repeating the percentage without that context is misleading.
What should crypto investors watch around this meeting?
Focus on global yields, the dollar, equity indices and crypto positioning rather than the headline alone. If everything tightens at once and on-chain behaviour worsens, risk rises. If the reaction is contained, the event may simply clear excess leverage.
Is this the end of the crypto cycle?
A single Bank of Japan hike is unlikely to end a multi-year cycle on its own. A true cycle top would usually require tighter US conditions, a stronger dollar, stretched valuations and clear on-chain distribution all lining up together.
If This Helped You, Here Is How Macro Heat Fits In
If this piece helped you see the Bank of Japan in context, Macro Heat is where we do this every week… tracking central banks, yields, the dollar and risk appetite, then tying it back to Bitcoin, Ethereum and the wider crypto board in plain English.
Alpha Insider members get:
➡️ Kairos timing windows to plan entries before the crowd moves
➡️ A full DCA Targets page with levels mapped for this cycle
➡️ Exclusive member videos breaking down charts in plain English
➡️ A private Telegram community where conviction is shared daily
➡️ A dedicated Macro Analysis page with regularly updated analysis and monthly reports
Legal And Risk Notice
Nothing in this article is financial, investment or trading advice. It is educational information only and reflects frameworks used by The Markets Unplugged. Cryptoassets are highly volatile and you can lose all the capital you commit. Always do your own research, size positions responsibly and consult a qualified professional if you are unsure whether any strategy, product or interpretation is appropriate for your circumstances.


Discussion