


Key Points
- Spending age metrics show whether older Bitcoin supply is moving or ageing in place, which affects distribution risk and available float.
- Coin Days Destroyed highlights raw dormant age being spent, Dormancy Flow normalises that behaviour to network size, and VDD Multiple shows value adjusted spending pressure versus long-term baseline.
- The cleanest signal is persistence across weeks, not one-off spikes.
- Rising spending age into rallies can reflect distribution pressure. Cooling spending age after drawdowns can reflect a reset in long-term selling pressure.
- These indicators work best with confirmation from profit and loss, cost basis, and venue flows, especially SOPR, realised profit and loss, realised price bands, exchange netflows, and miner flows.
- This guide is part of the Bitcoin on-chain series. For the full library of indicators and explainers, see the Bitcoin on-chain indicators hub.
- If any terms feel unfamiliar, use the Crypto Glossary, then return here.
Quick Answer
Coin Days Destroyed, Dormancy Flow, and VDD Multiple help you track the age of coins being spent. When older coins move in size, it can signal long-term holders distributing into strength or capitulating into weakness. CDD shows the raw age spent, Dormancy Flow shows whether that spending age is extreme relative to network size, and VDD Multiple highlights value weighted old coin movement versus a long-term baseline. Use these as weekly regime context, then confirm with cost basis and profit and loss behaviour before forming a view.
What Spending Age Metrics Are And Why They Matter
Spending age metrics ask a simple question. When coins move, how long have they been dormant. If mostly young coins are trading, the market is dominated by short-term churn. When very old coins start to move, it often marks important shifts in conviction, as long-term holders either distribute into strength or capitulate into weakness.
In Bitcoin, three spending age lenses are particularly useful:
- Coin Days Destroyed (CDD) for raw age spent
- Dormancy Flow for spending age normalised to network value
- Value Days Destroyed (VDD) Multiple for value adjusted spending pressure relative to trend
Together they show not just that coins are moving, but whether the moves are meaningful in the context of the current cycle.
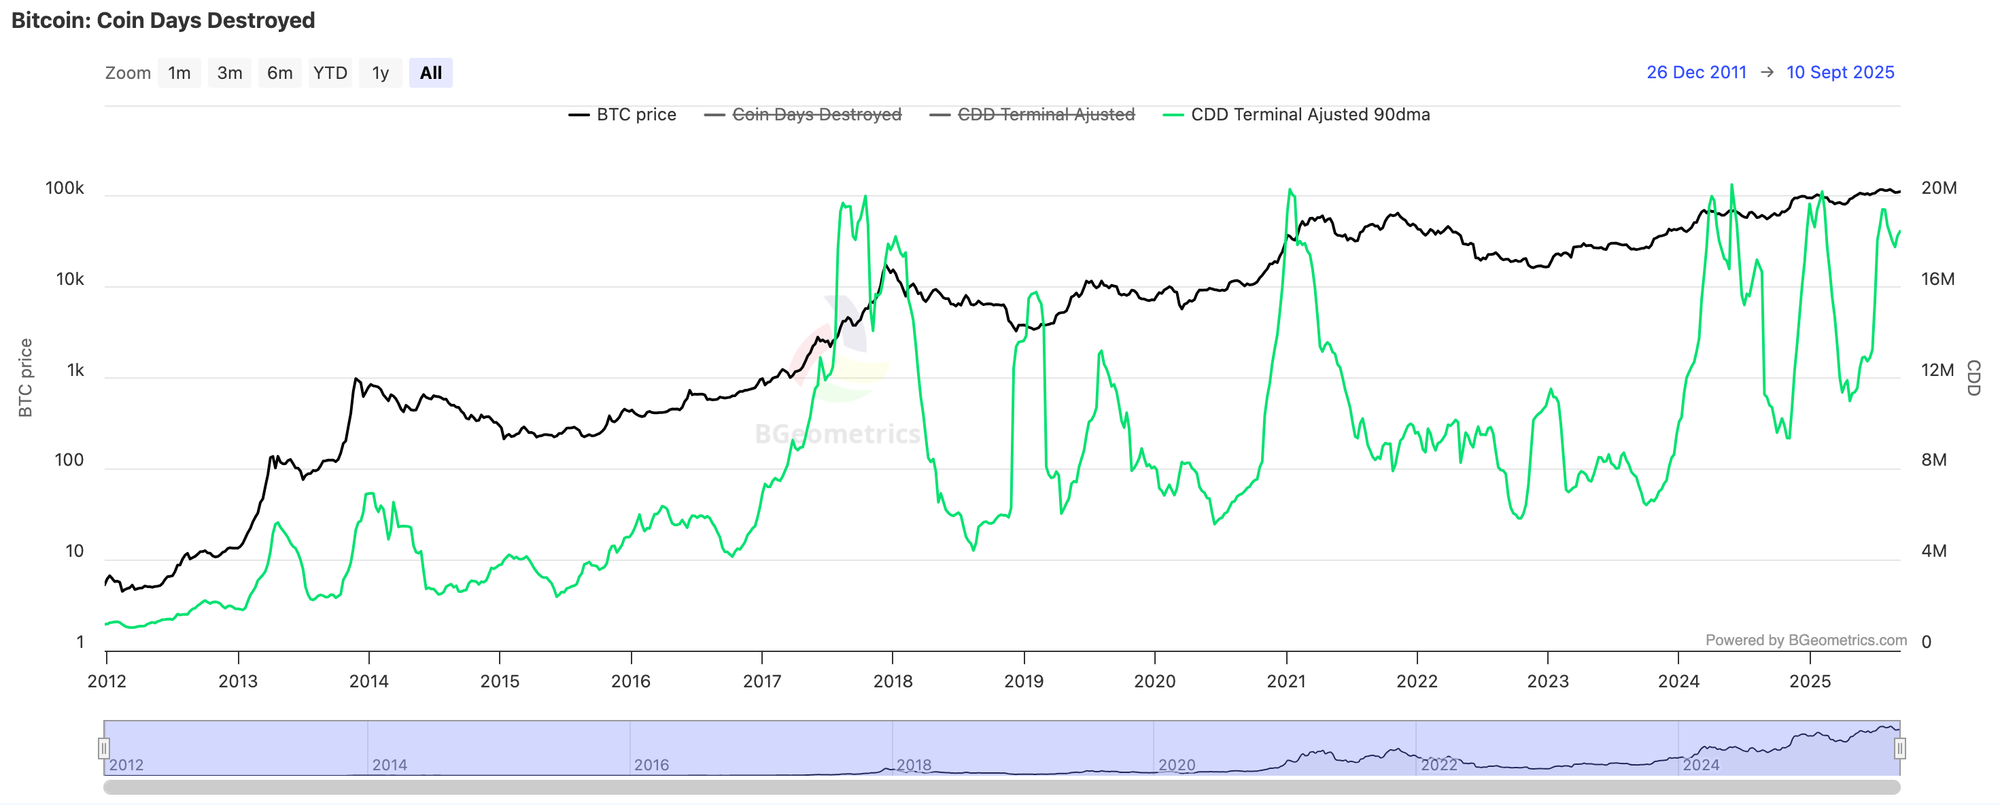
This chart plots terminal adjusted Coin Days Destroyed against price. Big green waves highlight periods when older coins moved in size. Across past cycles, towering CDD surges have often appeared around major tops as long-term holders distributed into strong rallies.
A version with long and short moving averages helps you see regime shifts even more clearly. When CDD sits above the long moving average into a rally, distribution risk is elevated. When it sits below the long moving average after sell-offs, it often marks reset phases where older supply is back in saving mode.
Coin Days Destroyed As The Raw Age Spent Signal
Coin Days Destroyed multiplies the number of coins moved by how many days those coins have been dormant. A ten Bitcoin spend that was idle for one hundred days destroys one thousand coin-days. This makes large movements of older coins stand out clearly compared with rapid trading of fresh coins.
Because the raw series is noisy, most traders use a smoothed or terminal adjusted view.
- Rising CDD into new highs as price pushes up suggests that older supply is being spent into strength. Distribution risk is building.
- Collapsing CDD after a washout shows that older coins have gone quiet again. That backdrop is more constructive for rebuilding.
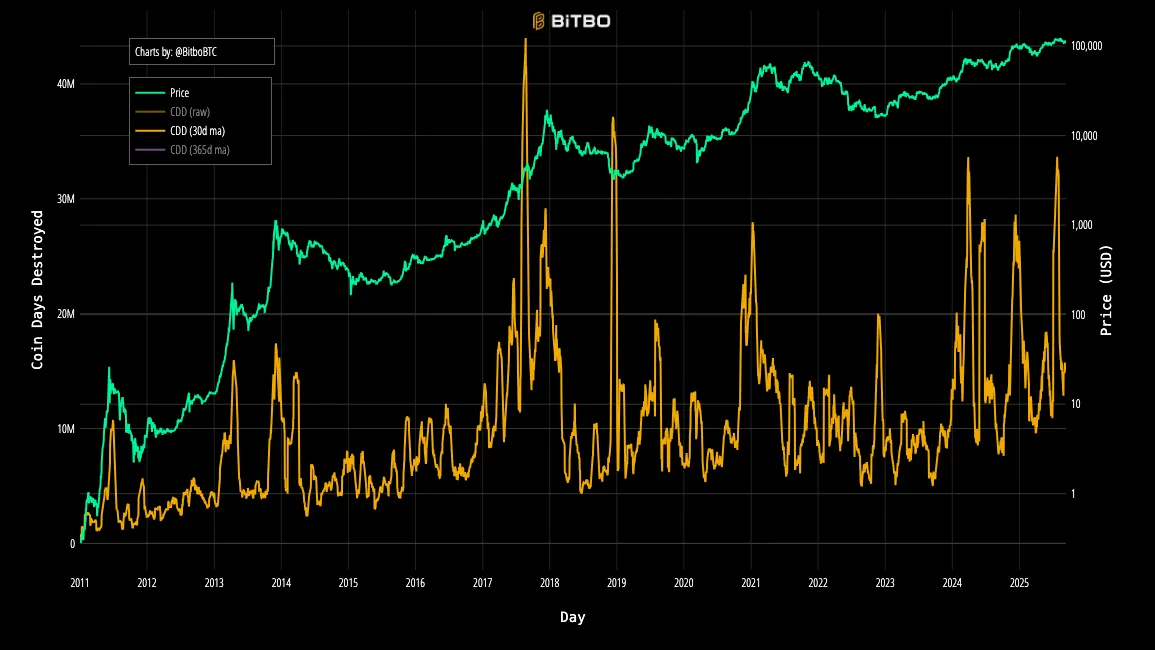
The MA lines help you see regime shifts… above the long MA into a rally = distribution risk… below it after sell-offs = reset.
Dormancy Flow Adjusting For Network Size
Dormancy is the average age of coins being spent over a given window. Dormancy Flow takes this concept and scales it by Bitcoin’s network value to flag extremes. In effect, it asks whether old coin spending is intense relative to how large Bitcoin is today.
- Very low Dormancy Flow readings have clustered around accumulation and value zones in past cycles, where older holders largely sit still and patient bids have been rewarded.
- Very high Dormancy Flow readings show late-stage distribution where older supply is hitting bids in size, often after months of strong price action.
Treat Dormancy Flow as a context gauge. It tells you whether spending age is high or low given market size, not whether to buy or sell on a given day.
VDD Multiple Putting Topside Pressure In One Glance
Value Days Destroyed converts coin-days into value-days by multiplying by the dollar price, then compares that to a long-term baseline. The VDD Multiple pops when large, old, high value coins move into rallies, making it a clean way to see whether OG holders are using strength to distribute.
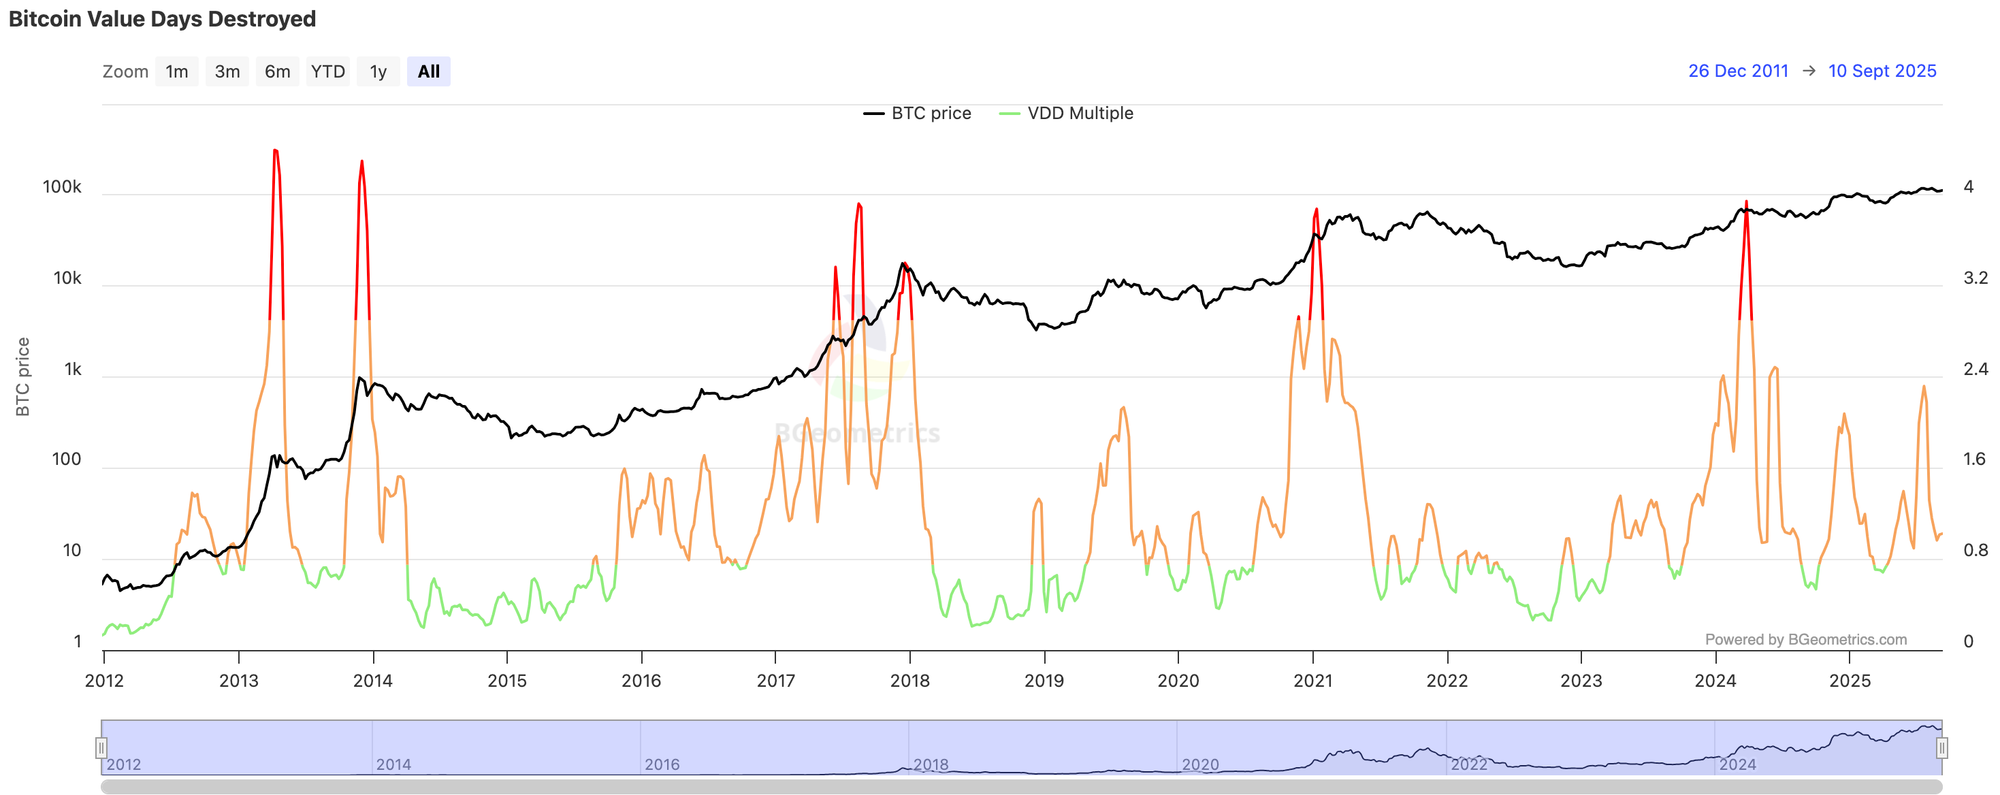
In historical data, major VDD spikes have aligned with late-stage distribution clusters. The surges around 2013, 2017, 2021 and 2024 all show periods where older, high value coins moved aggressively into strength. When these spikes arrive without convincing fresh price extension, it is often a sign that rallies are being used as exit liquidity.
Practical Guide Rails For Spending Age Signals
Spending age signals are guide rails, not gospel. They work best when you interpret them alongside price, flows and other on-chain dials.
- CDD surging while price pushes into highs
Distribution risk is rising. It often pays to tighten risk, pre-plan trims and be more selective with adds. - CDD cooling after deep drawdowns
Older coins quieten down. This pattern commonly precedes rebuild phases where the market can base if other indicators support it. - Dormancy Flow at cyclical lows
These zones have historically aligned with value areas where patient bids have been rewarded, although price can undershoot inside the zone. - VDD Multiple spike clusters with flat price
When value adjusted spending surges repeatedly without strong price extension, it suggests supply is hitting rallies. That is usually a cue to fade strength in weaker names and avoid chasing late in the move.
None of these should be treated as single point triggers. The edge sits in direction and persistence across weeks, not in one bar.
How To Pair Spending Age With Other Dials
Spending age metrics are powerful when plugged into a small confluence basket.
- CDD or VDD rising with healthy profit regime
CDD or VDD rising while the Realised PnL Ratio is above one and SOPR is above one points to healthy profit-taking in trend. Dips can be bought and rips trimmed rather than fully faded. - CDD rising while Realised PnL Ratio sits below one
This combination hints at distribution into weakness rather than orderly profit-taking. Standing aside or tightening risk is usually better than adding. - Dormancy Flow lifting from troughs with cooler derivatives
Dormancy Flow turning up from low levels while funding cools and open interest rebuilds from cleaner levels can support methodical risk adds. - Any spending age spike alongside rising miner to exchange flows
When spending age spikes and miners are sending more coins to exchanges, respect the supply wave. That is not the time to be complacent.
The structure is simple. Spending age tells you which coins are moving; PnL, derivatives and miner data tell you how that movement is being absorbed.
What The Long Term Charts Are Saying
Across cycles, major VDD spikes have tended to align with late-stage distribution. CDD waves often front-run those tops as older supply begins to move before the final blow off. Dormancy Flow troughs have repeatedly clustered around value zones where the market was cheap relative to long-term behaviour.
Recent cycles have shown sizeable but less extreme VDD pops and pulsed CDD waves rather than constant one-way euphoria. That pattern often fits a market where it makes sense to sell the rips and buy the resets rather than expecting a straight line.
A Simple Workflow You Can Reuse
You can fold spending age metrics into a straightforward weekly routine.
- Keep three tabs open: smoothed CDD, Dormancy Flow and VDD Multiple.
- Each week, tag the regime as distribution if CDD and VDD are rising together, or as reset and quiet if CDD is cooling and Dormancy sits near low levels.
- After drawdowns, consider adding risk once CDD cools and price has reclaimed key levels instead of buying during the heaviest spending waves.
- Trim exposure when VDD pops repeat without strong price extension and other indicators hint at fatigue.
- Around CPI, FOMC and major headlines, expect noisy spikes in spending age metrics. Wait for the weekly close to see whether anything truly changed.
Reviewing these dials once a week helps you focus on persistence and regime, not hot takes.
Mini FAQs
Is Coin Days Destroyed better than Dormancy Flow?
CDD and Dormancy Flow do different jobs. CDD shows raw old coin movement, while Dormancy Flow tests whether that movement is intense relative to today’s network size. Most useful frameworks use both rather than choosing one.
Can VDD Multiple time market tops on its own?
No. VDD Multiple flags value adjusted supply hitting the market. It can highlight late-stage conditions, but execution still depends on price action, realised PnL, SOPR, funding and open interest.
Do these spending age metrics still work as Bitcoin supply ages and ETFs grow?
Yes. Long dormant coins remain the marginal seller near peaks, and their behaviour still matters. ETFs and new custodians change some plumbing, but major surges in old coin spending are still informative when read in a basket.
How often should I check CDD, Dormancy Flow and VDD?
Weekly or monthly checks are usually enough. These are slow moving regime tools. Watching them every day can encourage over-reaction to small spikes.
What is the main limitation of spending age metrics?
They do not show you where coins go after they move and they can be distorted by large internal transfers or custody changes. They should be combined with exchange flows, derivatives data and simple price structure, not used in isolation.
If this guide helped you read Bitcoin spending age without guesswork, consider joining Alpha Insider for weekly on-chain dashboards, timing windows and member videos. Fewer mistakes, cleaner execution and more conviction during difficult parts of the cycle.
Alpha Insider members get:
➡️ Kairos timing windows to plan entries before the crowd moves
➡️ A full DCA Targets page with levels mapped for this cycle
➡️ Exclusive member videos breaking down charts in plain English
➡️ A private Telegram community where conviction is shared daily
This isn’t noise… it’s the full playbook.
Legal And Risk Notice
This guide is for education only. It is not financial, investment, legal, accounting or tax advice, and nothing here is a recommendation to buy, sell or use any product or service. Cryptoassets are high risk and prices can go to zero. Only use amounts you can afford to lose, verify any providers you use and follow the rules in your country before acting. You are responsible for your own decisions and should consult a qualified adviser where appropriate.


Discussion