


Key Points
- Supply Last Active shows how much BTC has not moved for at least 1, 2, or 3 years, it is a direct window into dormancy and potential sell pressure.
- Rising 1y+, 2y+, and 3y+ shares together usually means saving behaviour and tighter float. Broad rollovers often signal older coins re-entering circulation.
- The best signal is multi-week direction across bands, not a single week move.
- Confirm rollovers with spending-age tools (CDD or VDD, ASOL or MSOL) and profit acceptance (SOPR or Realised PnL Ratio).
- This guide is part of the Bitcoin On-Chain Indicators hub.
- If any terms feel unfamiliar, use the Crypto Dictionary.
Quick Answer
Supply Last Active groups BTC by the last time it moved on-chain. The 1y+, 2y+, and 3y+ cohorts show the share of supply that has stayed dormant for at least one, two, or three years. When these bands rise together, float tightens and near-term sell pressure is usually lower. When they roll over together for weeks, older coins are returning to circulation, and distribution risk rises.
Answer Block
Treat this as a backbone context metric, not a standalone trigger. A single dip in 1y+ can be simple band migration. The higher-confidence signal is broad rollovers across 1y+, 2y+, and 3y+ that persist and align with higher old-coin spending and rising profit-taking acceptance.
What Supply Last Active Measures
Supply Last Active measures how long coins have remained unmoved on-chain, grouped into age bands.
- 1y+ shows the share of supply unmoved for at least one year
- 2y+ shows the share of supply unmoved for at least two years
- 3y+ shows the share of supply unmoved for at least three years
Rising shares signal saving behaviour and reduced near-term sell pressure. Declining shares signal older coins re-entering circulation, often around late-cycle distribution or during capitulation resets.
Why Dormant Supply Matters
Dormant supply is the market’s anchor. When a larger portion of supply sits in 1y+, 2y+, and 3y+, fewer coins are available to chase price, elasticity drops, and smaller demand spurts can move price further.
When these bands roll over together, dormant holders are spending, liquidity returns, and major transitions often follow. Timing is never perfect from one metric alone, so treat this as context, then confirm with other dials.
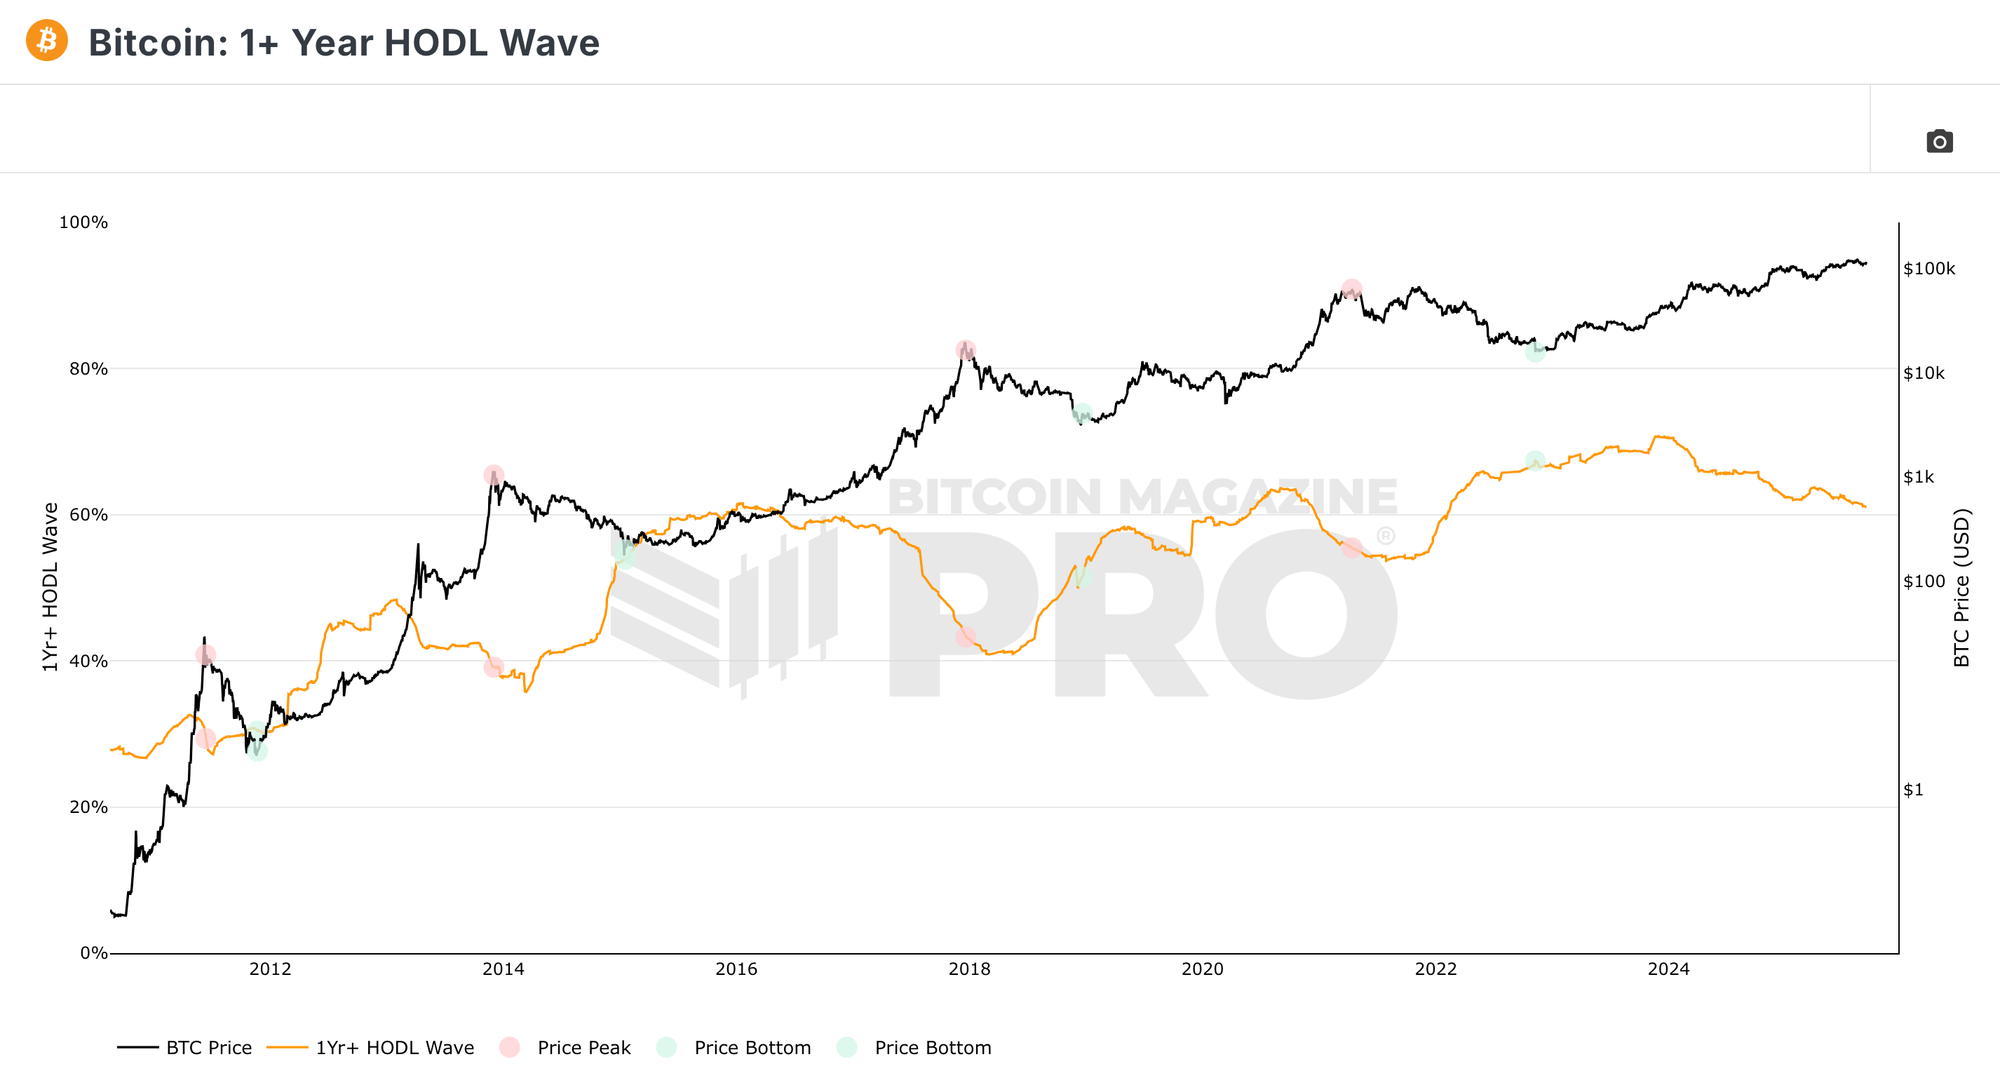
This line shows the share of supply unmoved for at least one year alongside price. High and rising levels often align with saving behaviour, sustained rollovers closer to cycle highs often align with distribution.
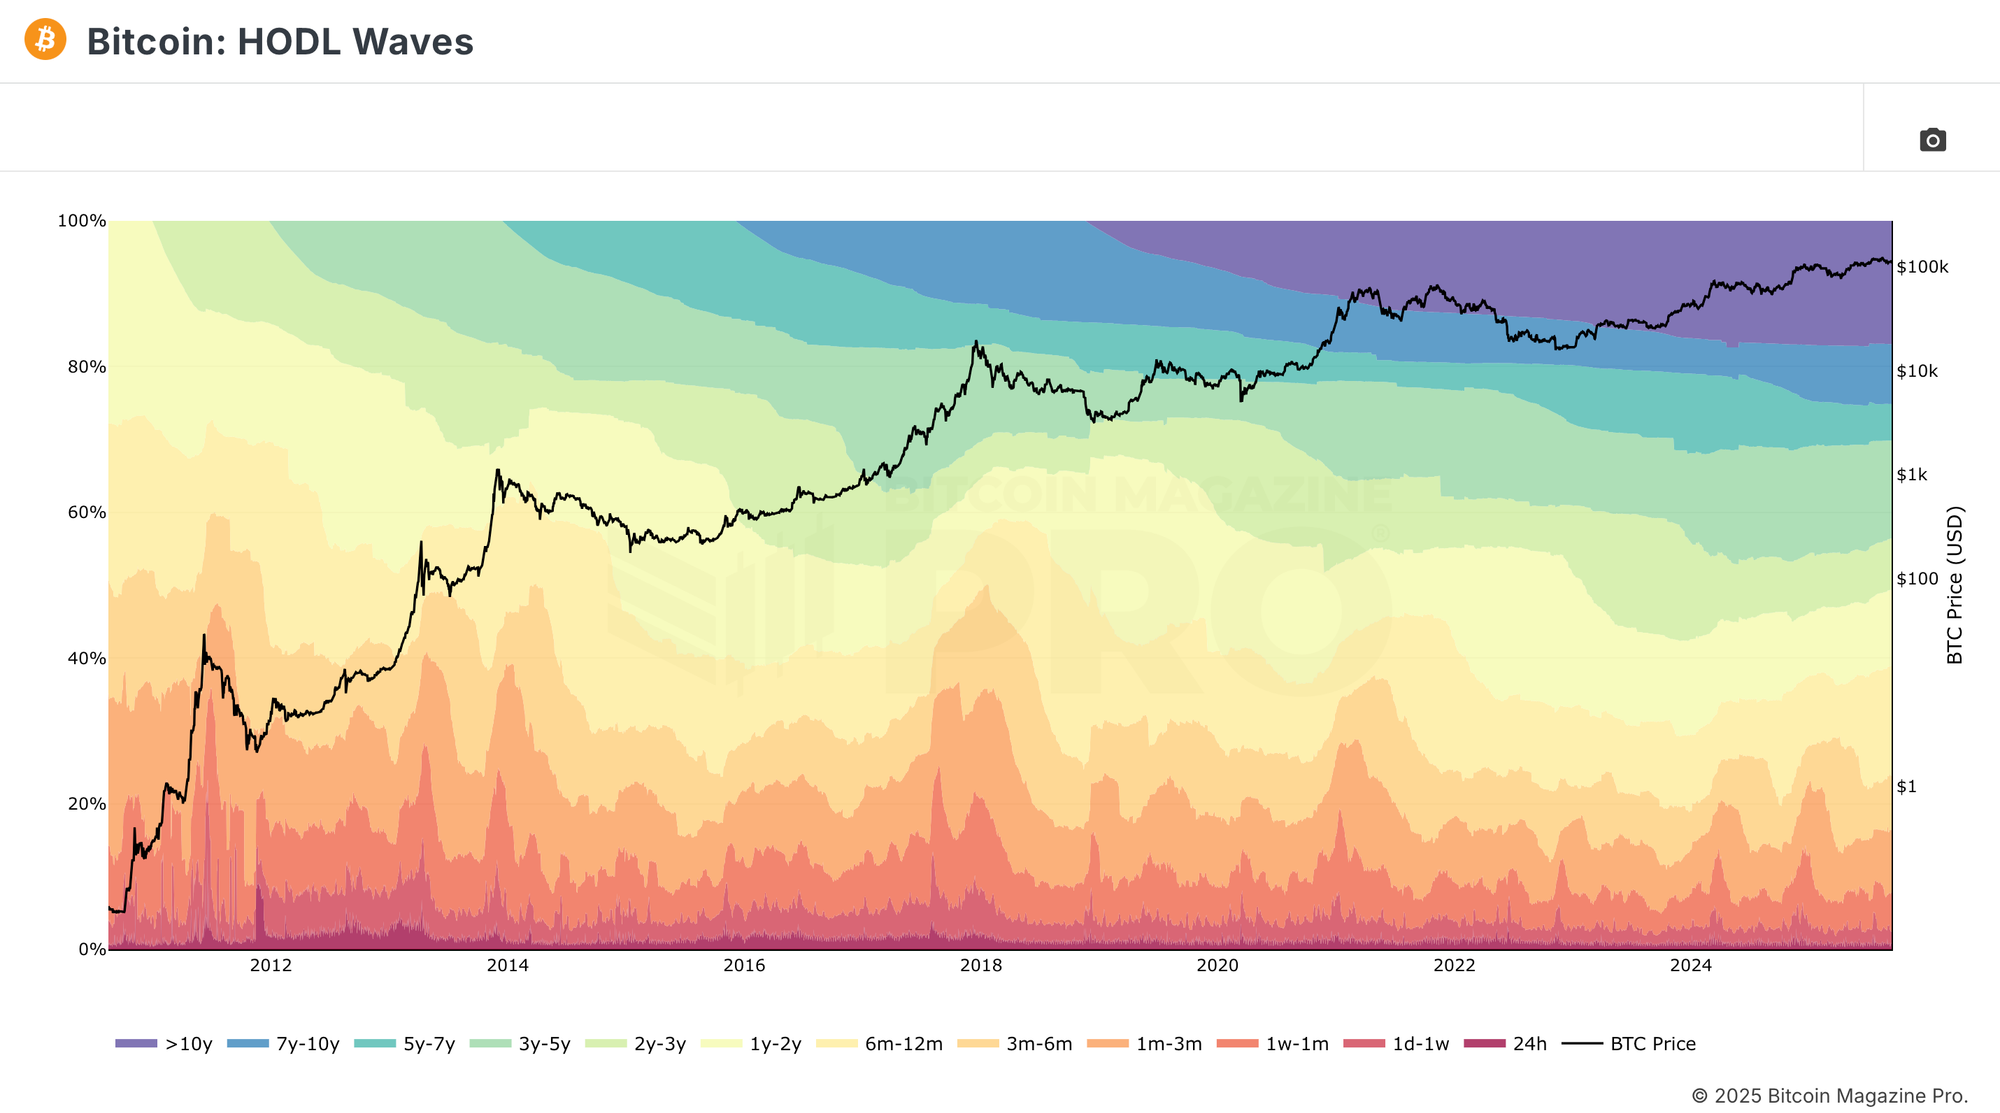
Stacked age bands show the full distribution of coin ages. Expanding upper bands (1y+, 2y+, 3y+) mean growing dormancy, thinning upper bands while younger bands swell often indicates older coins are being spent.
How To Read The 1y+, 2y+, 3y+ Bands
Direction And Synchrony
- Upward slope across all three bands suggests dormancy is building and float is tightening.
- Simultaneous rollovers suggest older coins are moving, watch for distribution windows.
Rate Of Change
- Fast falls in 1y+ with flatter 2y+ and 3y+ can be benign, coins are often ageing into older bands.
- Fast falls across all three together point to meaningful spending.
Sequence
A common rhythm through cycles looks like this:
- 3y+ tends to grow through late bear and early bull phases
- 1y+ often lags, then accelerates
- late in a cycle, 1y+ often rolls first, then 2y+, then 3y+ if the unwind is heavy
Confluence
Pair with spending metrics like ASOL or MSOL, CDD or VDD, and profit metrics like SOPR or the Realised PnL Ratio. A rollover in 1y+, 2y+, 3y+ alongside rising old-coin spending and persistent profit acceptance is a cleaner signal than any single chart.
Thresholds are guide rails. The real signal is persistence and whether the bands move together.
- High Dormancy Regime
1y+ around 60% and rising, with 2y+ and 3y+ stable or rising, supply is tighter and dips often get absorbed. - Early Distribution Regime
1y+ stalls or drifts lower while 2y+ and 3y+ remain elevated, mild spending, often mid-cycle rotations rather than cycle ends. - Late Distribution Regime
1y+, 2y+, and 3y+ roll together for weeks, confirm with higher old-coin spending (CDD or VDD) and stronger profit-taking signals (SOPR persistent above 1). - Bear Reset Regime
1y+ falling while younger bands expand and price is weak, capitulation can clean the slate, future dormancy rebuilds from there.
A Simple Workflow You Can Reuse
- Context
Check HODL Waves for the full age-band picture. - Focus
Open the 1y+ line chart for a clean slope read, then compare with 2y+ and 3y+. - Change
Note the 4 to 8 week rate of change, do the bands rise together, stall, or fall together. - Confirm
Cross-check CDD or VDD, ASOL or MSOL, and SOPR or Realised PnL Ratio, look for alignment. - Act
Use this to inform pace, not prediction, add more patiently in high-dormancy regimes, scale risk down when broad rollovers meet profit-taking signals.
Worked Examples You’ll See Often
- Post-Bear Rebuild
1y+, 2y+, 3y+ climbing together, SOPR muted, ASOL and MSOL low, saving dominates, pullbacks are often opportunities. - Late Advance
1y+ turns down, 2y+ flat, 3y+ flat, older coins nibble at liquidity without a full exit, often a warning to tighten risk without abandoning trend. - Distribution Window
All three bands roll, CDD and dormancy tools lift, SOPR stays above 1 with spikes, treat strength as distribution risk until the rollovers stabilise.
Common Snags To Avoid
- Mistaking band migration for selling, a drop in 1y+ with flatter 2y+ may be coins ageing into older cohorts.
- Reading a single week, these are slow signals, wait for multi-week shifts.
- Ignoring spend quality, confirm with age-of-spend metrics, not all spending carries the same information.
Mini FAQs
Is rising 1Y+ always bullish?
Not always. Rising 1Y+ often supports tighter float, but if price is euphoric while 1Y+, 2Y+, and 3Y+ begin rolling over together, risk can rise.
What if 1Y+ drops but 2Y+ and 3Y+ rise?
That can be relatively neutral. In some cases, coins are ageing into older cohorts rather than being aggressively spent.
Which confluence is most helpful?
The cleanest mix is usually older-supply rollover plus higher old-coin spending and stronger profit-acceptance signals, especially through tools such as SOPR and the Realised PnL Ratio.
The latest change in this on-chain signal, how it should be read in context, and what it implies from here will be covered in the weekly member update. Alpha Insider members get this analysis in real time every week across KAIROS timing, on-chain data, and macro signals. Explore membership here.
Legal And Risk Notice
This guide is for education only, not financial, investment, legal, accounting, or tax advice. Nothing here is a recommendation to buy, sell, or use any product or service. Cryptoassets are high risk and prices can go to zero. Only use amounts you can afford to lose. Availability and legality vary by country, so check your local rules before acting. You are responsible for your own decisions.


Discussion