


Key Points
- RHODL Ratio is a Bitcoin on-chain indicator built from realised value age bands, designed to track whether newer capital is overheating relative to older capital.
- It uses realised age bands to compare younger cohorts against older cohorts, so it reflects rotation and speculative pressure, not just price.
- The most useful read is persistence and regime shifts… not a single spike.
- RHODL works best when confirmed with cost basis and behaviour indicators, especially realised price bands, MVRV, NUPL, SOPR, and realised profit and loss.
- Use RHODL to frame cycle risk and crowding, then check whether holders are actually spending into strength.
- Weekly reads are usually enough for most people… daily checks can add noise without changing the regime view.
- This guide is part of the Bitcoin on-chain series. For the full library of indicators and explainers, see the Bitcoin on-chain indicators hub.
- If any terms feel unfamiliar, use the Crypto Glossary, then return here.
Quick Answer
RHODL Ratio compares the realised value of younger cohorts against older cohorts to highlight when newer demand is dominating and getting crowded. Higher readings suggest rotation is pushing value into younger age bands, which can align with hotter market conditions when profit-taking behaviour confirms. Lower readings suggest older capital is still dominant or newer demand is muted, which can align with quieter regimes. Use RHODL as a rotation and regime lens, then confirm with cost basis and spending behaviour before forming a view.
What Is the RHODL Ratio?
RHODL Ratio compares the realised value held by young coins with the realised value held by older coins to gauge where wealth is concentrated across age bands. In practice it contrasts very recent coins (for example, 1 week) against older holders (for example, 1–2 years). When the ratio rises, realised value tilts toward newer hands; when it falls, older hands dominate.
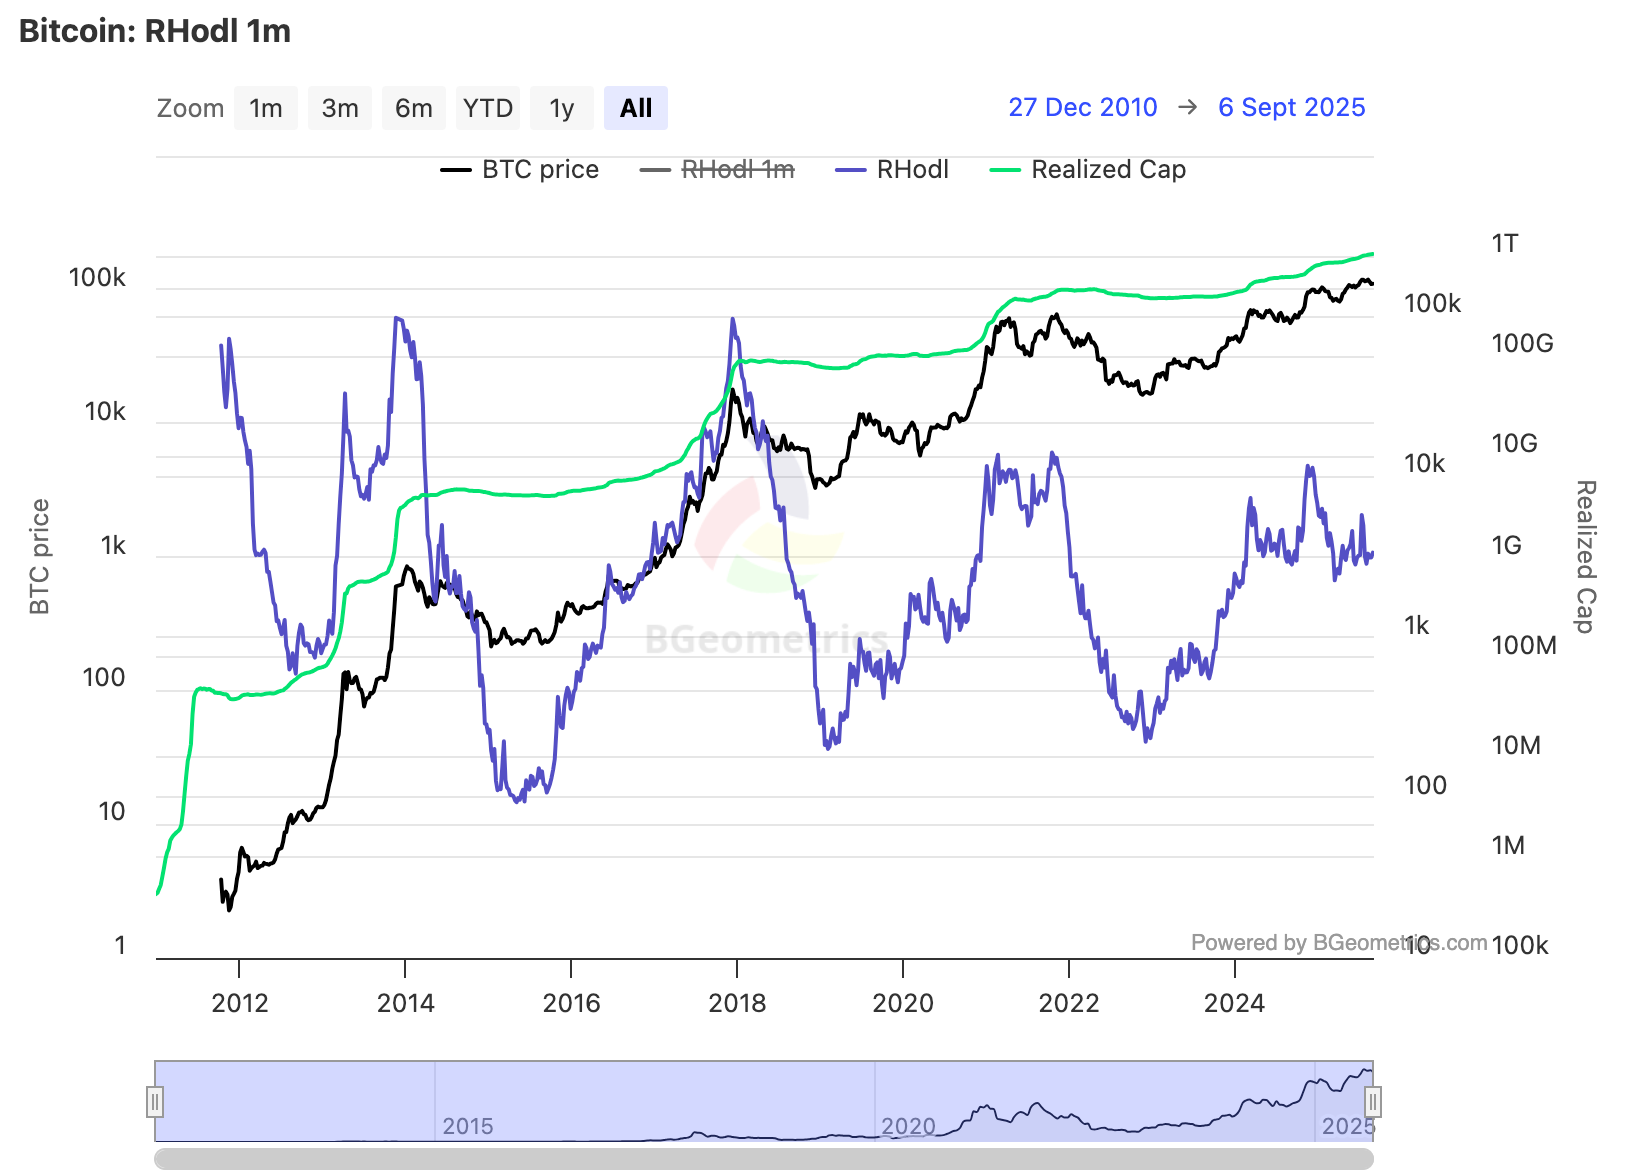
Bitcoin RHODL Ratio (monthly): Source BGeometrics
This chart shows the balance between young and old realised value, highlighting areas linked with late-cycle risk and deep-cycle accumulation.
How Is RHODL Ratio Calculated?
- Start with Realised HODL Waves (realised value allocated by coin age).
- Take the realised value in a young band (commonly 1 week).
- Divide by the realised value in an older band (commonly 1–2 years).
- Many dashboards apply smoothing or scaling to improve readability.
Exact implementations vary slightly across providers. Focus on the young vs old realised value balance, not a single fixed number.
Why RHODL Matters
- Cycle lens: High readings often align with periods when recent buyers dominate, a hallmark of late bull phases; low readings align with periods where older capital holds sway.
- Rotation tell: Rising RHODL can flag redistribution from patient holders to newcomers; falling RHODL points to consolidation in stronger hands.
- Context for valuations: Paired with valuation and spending metrics, RHODL helps judge whether advances are broad-based or driven by short-term wealth transfer.
Interpreting Zones
Treat these as guides, not triggers; regimes can migrate as the market matures.
- Depressed zone: older bands dominate realised value; common during late bear and early recovery periods.
- Rising mid-zone: participation broadens; watch confluence to separate sustainable advances from froth.
- Elevated zone: young bands dominate realised value; historically where distribution risk increases.
Practical Reads
- Inflections matter: a turn up from depressed levels often coincides with improving participation; a roll-over from elevated levels can precede cooling.
- Duration over prints: short spikes can be noise; sustained elevation carries more weight.
- Cross-check cohorts: combine with STH/LTH profitability to see who is actually under pressure.
Use RHODL With Confluence
Pair with:
- Realised Price Bands (Market/LTH/STH): is rising RHODL meeting firm cost-basis support or thin air?
- SOPR / Realised PnL: are newer coins realising profit into the market, or is absorption strong?
- Dormancy / CDD: are older coins actually moving, or is RHODL rising purely from young-coin value?
Common Traps To Avoid
- Treating a single threshold as universal across cycles.
- Ignoring smoothing and provider differences in age buckets.
- Reading RHODL in isolation without checking whether old supply is truly rotating.
A Simple Workflow You Can Reuse

- Open RHODL Ratio (weekly) and note level and direction.
- Check Market/LTH/STH Realised Price for valuation support.
- Confirm behaviour with aSOPR and Realised PnL.
- Scan Dormancy/CDD to validate whether older coins are in motion.
- Decide: broadening participation with support, or late-phase risk with distribution.
Mini FAQs
What does RHODL Ratio tell you in simple terms?
It shows whether newer capital is becoming dominant versus older capital, using realised value age bands as the input.
Is RHODL the same as HODL Waves?
No. HODL Waves show supply by age. RHODL is a ratio that compares younger realised cohorts to older realised cohorts, which makes it more of a rotation and regime tool.
Does a high RHODL Ratio always mean a top is near?
No. High readings can persist in strong advances. Risk rises when RHODL stays elevated and other indicators confirm distribution.
What should confirm a RHODL read?
Use realised price bands for cost basis context, SOPR or realised profit and loss for behaviour, and exchange netflows or spending-age indicators to check whether supply is being sold into demand.
Why can RHODL rise while price chops sideways?
Because realised value can rotate between cohorts even if spot price is not trending. That is why RHODL is best read alongside behaviour and cost basis.
How often should RHODL be checked?
Weekly is usually enough. Focus on sustained shifts rather than short-term noise.
If this helped you read age-band pressure more clearly, Alpha Insider members can access deeper Bitcoin on-chain analysis and commentary here.
Alpha Insider members get:
➡️ Kairos timing windows to plan entries before the crowd moves
➡️ A full DCA Targets page with levels mapped for this cycle
➡️ Exclusive member videos breaking down charts in clear, simple terms
➡️ A private Telegram community where conviction is shared daily
Built for steadier weekly context… with indicators read together, not alone.
Legal And Risk Notice
This content is for education only and does not constitute financial advice. Crypto assets are volatile and you can lose money. Always do your own research and consider your risk tolerance.


Discussion