


The Month Unplugged
September 2026
| Call | Where | When | Outcome |
|---|---|---|---|
| Two to three weeks of consolidation after the breakout, then higher into Q4 | Member video | 31 August | Hit. Three weekly closes held between $76,816 and $80,341, then the week of 20 September moved higher |
| The altcoin reset is normal: first break, then pullback, then break up | Member video | 14 September | Hit. Back above the bottom zone one week after slipping into it |
| Altcoin market wave one to $240bn to $270bn | Member video | 14 September | Hit at $240bn. Weekly close of $253.6bn on 27 September, from $203bn at the call |
| Bitcoin order flow extends into the week of 27 September | Member video | 21 September | Miss. It needed more buying and more volume. Volume rose to 35.7B, but the week netted $50 million of selling |
| Mid-cycle correction holds unless new lows below $57,748 (four posts, one call) | Public on X | 10 June to 14 July | Open. Resolves at the end of October |
| No new Bitcoin all-time high in 2026 | Public on X | 25 September | Open. Resolves 31 December |
| Altcoin market confirms its exit from the bottom zone | Member video | 14 September | Two of three so far. Resolves by 30 November |
| Bitcoin dominance, two calls | Oz Updates | 12 and 14 September | Open. Terms revealed when it resolves, 31 October and 14 December |
| Ethereum, two calls | Member video | 14 September | Open. Terms revealed when it resolves, 14 December |
| Ethereum | Member video | 7 September | Open. Terms revealed when it resolves, 14 December |
| Bitcoin | Member video | 14 September | Open. Terms revealed when it resolves, 14 December |
| Bitcoin | Oz Updates | 22 August | Open. Terms revealed when it resolves, 31 March |
| Altcoin market, two calls | Member video | 21 and 28 September | Open. Terms revealed when it resolves, 14 December and 31 March |
| Altcoin market | Member video | 21 September | Open. Terms revealed when it resolves, 31 January |
| Altcoin market | Member video | 14 September | Open. Terms revealed when it resolves, 28 February |
| Bitcoin | Member video | 21 September | Open. Terms revealed when it resolves, 31 December |
| Bitcoin | Member video | 28 September | Open. Terms revealed when it resolves, 31 December |
On 21 September I set a specific test for the week ahead. Bitcoin had just closed at $81,158 on $178 million of net buying, and I said the move would extend if the next week brought more of both: net buying above $178 million and volume above 30.7 billion. Both, not one.
Half of it came. Volume rose to 35.7 billion. The buying did not. Monday alone brought $543 million of buying and took price through the May high, then Tuesday to Thursday sold $527 million back into it. The week finished at $50 million of net selling, with open interest falling as longs took profit.
Price closed higher anyway, at $84,442, the best close of the recovery. That does not rescue the call. The call was about the flow behind the move, and the flow did not show up. It goes in the table as a miss, at the same size as the hits.
What I read wrong was the character of the flow, not the direction. I did not anticipate that the new buying would last only a couple of days, or that profit-taking would arrive so quickly behind it. It was not a squeeze building into the level. It was a profit-taking week going into a major level, and that is a different animal even when the candle closes green.
The lesson I am taking forward is that order flow has more than one story behind the same price move. Fresh buying, short covering and profit-taking into a level can all sit under a higher close, and a one-week test has to allow for which one is actually happening. From here, the flow calls I make will say which of those I expect, not just which way price goes.
Every 30 weeks a new box opens. Box 27 opened on 18 May 2026, and the phase badge shows where each market sat in its own cycle range on that day. September covered weeks 16 to 19. Below is what each market did inside the box this month, week by week. It is a record of the month, nothing more.
| Wk | Week of | Close | Change | In the box |
|---|---|---|---|---|
| 16 | 31 Aug | $80,341 | +3.4% | New high |
| 17 | 7 Sep | $76,816 | −4.4% | |
| 18 | 14 Sep | $81,158 | +5.7% | |
| 19 | 21 Sep | $84,442 | +4.0% | New high |
New box high in weeks 16 and 19, the latest at $87,330. The box low from week 7 ($57,945) held all month.
| Wk | Week of | Close | Change | In the box |
|---|---|---|---|---|
| 16 | 31 Aug | $2,514 | +4.0% | |
| 17 | 7 Sep | $2,477 | −1.5% | New high |
| 18 | 14 Sep | $2,645 | +6.8% | New high |
| 19 | 21 Sep | $2,689 | +1.6% | New high |
New box high in weeks 17, 18 and 19, the latest at $2,807. The box low from week 3 ($1,506) held all month.
| Wk | Week of | Close | Change | In the box |
|---|---|---|---|---|
| 16 | 31 Aug | $214.9bn | +12.4% | New high |
| 17 | 7 Sep | $199.1bn | −7.4% | New high |
| 18 | 14 Sep | $232.1bn | +16.6% | New high |
| 19 | 21 Sep | $253.6bn | +9.3% | New high |
New box high in weeks 16, 17, 18 and 19, the latest at $261.8bn. The box low from week 13 ($157.2bn) held all month.
Weekly data: Bitcoin from TMU’s weekly series, Ethereum (Binance), Others (TradingView CRYPTOCAP:OTHERS). Change is close on close.
A month ago the measure was 42 weeks into the bottom zone with no exit. It now has two weekly closes clear, one short of confirming. The two prior episodes ran 93 and 70 weeks and travelled 293% and 112%. After each one ended, the market was up 85% and 82% thirteen weeks later, with worst drops of 17% and 48% along the way.
Two ended episodes is a thin sample, and the exit is the event rather than the entry. Coins outside the top ten have also been leading this recovery, which is the reverse of 2023, when Bitcoin led. Context, not a signal.
Rates and credit moved the wrong way together for the first time this cycle. The stress sits at the edges: the lowest-rated corporate bonds, and the premium investors now demand to hold long-dated debt. Inflation expectations stayed anchored, so this is a repricing of the cost of money rather than an inflation scare. The core of the system, from funding markets to the broad stress indexes, is calm. Nothing has broken. Money is dearer.
October is the last month of the invalidation window. On 14 July, asked on X what would prove the mid-cycle read wrong, I gave a specific answer: new lows into September or October, meaning a break below $57,748. September came and went well above it. One month left, and it stays open in the scorecard until the window closes.
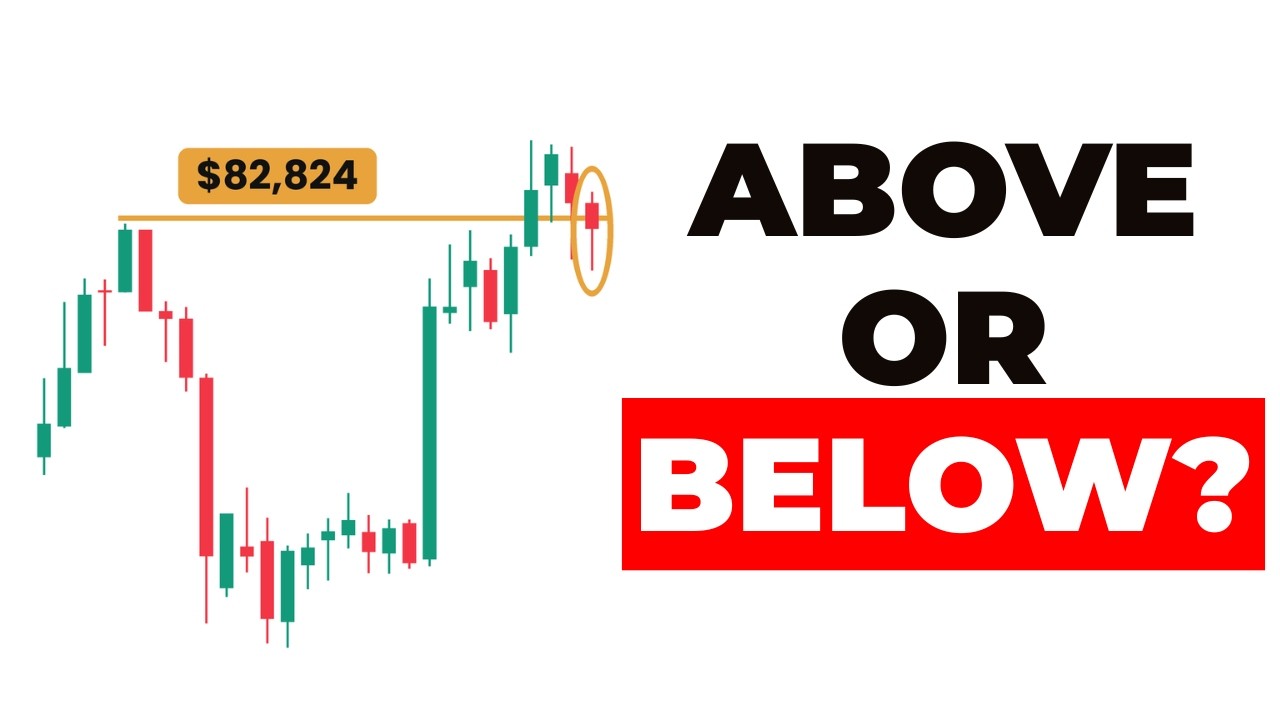
Three other things decide the month. The first weekly close of October either confirms the altcoin market's exit from its bottom zone, on a third close clear, or restarts the count. Bitcoin has to hold the May high on a weekly closing basis, because a close back below $82,824 would undo the break. And one open call on Bitcoin dominance resolves before October ends.
Underneath it all sits credit. High-yield spreads are just under 300 basis points, the level where credit stops being called tight. It is a convention rather than a tested trigger, and the speed of the move matters more than the number. If spreads keep widening at September's pace, that is the thing to watch ahead of any price level.
Members see every open call with its terms today, as it is made. Everyone else sees them here the month they resolve, hit or miss. The Month Unplugged stays free either way.
The Month Unplugged is the monthly record of what was called and what happened, published with the misses alongside the hits. Members read each of these calls the week it was made, in Oz Updates and the Monday member video.
Not financial advice. Always do your own research.




Discussion