


Key Points
- ETF netflows measure creations and redemptions at the fund wrapper level, they do not tell you which wallets sold.
- On-chain flows measure BTC moving between venues and wallets, but tagging and entity clustering can distort exact levels.
- The clean reconciliation uses three layers, ETF netflows, exchange reserves and netflows, and profit acceptance (SOPR or the Realised PnL Ratio).
- A common trap is treating ETF inflows as a guarantee of upside, supply response and holder behaviour decide the outcome.
- If you want quick definitions for netflows, reserves, SOPR, Realised PnL Ratio, custody, and CDD, see the Crypto Glossary.
Quick Answer
Bitcoin ETF netflows and on-chain flows track different parts of the system. ETF netflows show whether ETF shares are being created or redeemed, which reflects wrapper demand. On-chain flows show how BTC moves between exchanges, custody, and other wallet categories, which reflects liquidity and holder behaviour. To reconcile them, track ETF netflows alongside exchange netflows and reserves, then confirm whether realised profit is being absorbed using SOPR or the Realised PnL Ratio.
ETF demand can be strong while on-chain exchange netflows look muted because market makers and custodians can source coins from inventory, internal transfers, or off-exchange settlement. On-chain tells you whether supply is actually building on venues, and whether the market is accepting profit-taking while ETFs attract demand.
What Are Bitcoin ETF Netflows And On-Chain Flows
ETF netflows track creations and redemptions at the fund level, they show how much exposure investors bought or sold through ETFs.
On-chain flows track coins moving between addresses and venues, including inflows and outflows to exchanges, custodians, and other wallet groups.
The point is not to pick a favourite. It is to combine them so you can distinguish “new demand” from “demand being met by distribution”.
Why They Often Diverge
Custody Path: ETF creations can be supplied by custodians or liquidity providers, coins do not always move through spot exchange wallets the same day.
Internal Netting: Market makers can net client flows against inventory before touching chain, on-chain movement can lag.
Wallet Tagging: If a custodian wallet is not tagged the way you expect, some dashboards will miss or misclassify transfers.
Settlement Structure: Depending on the product and jurisdiction, creations and redemptions can be processed using cash and or in-kind mechanisms, which changes what you see on-chain.
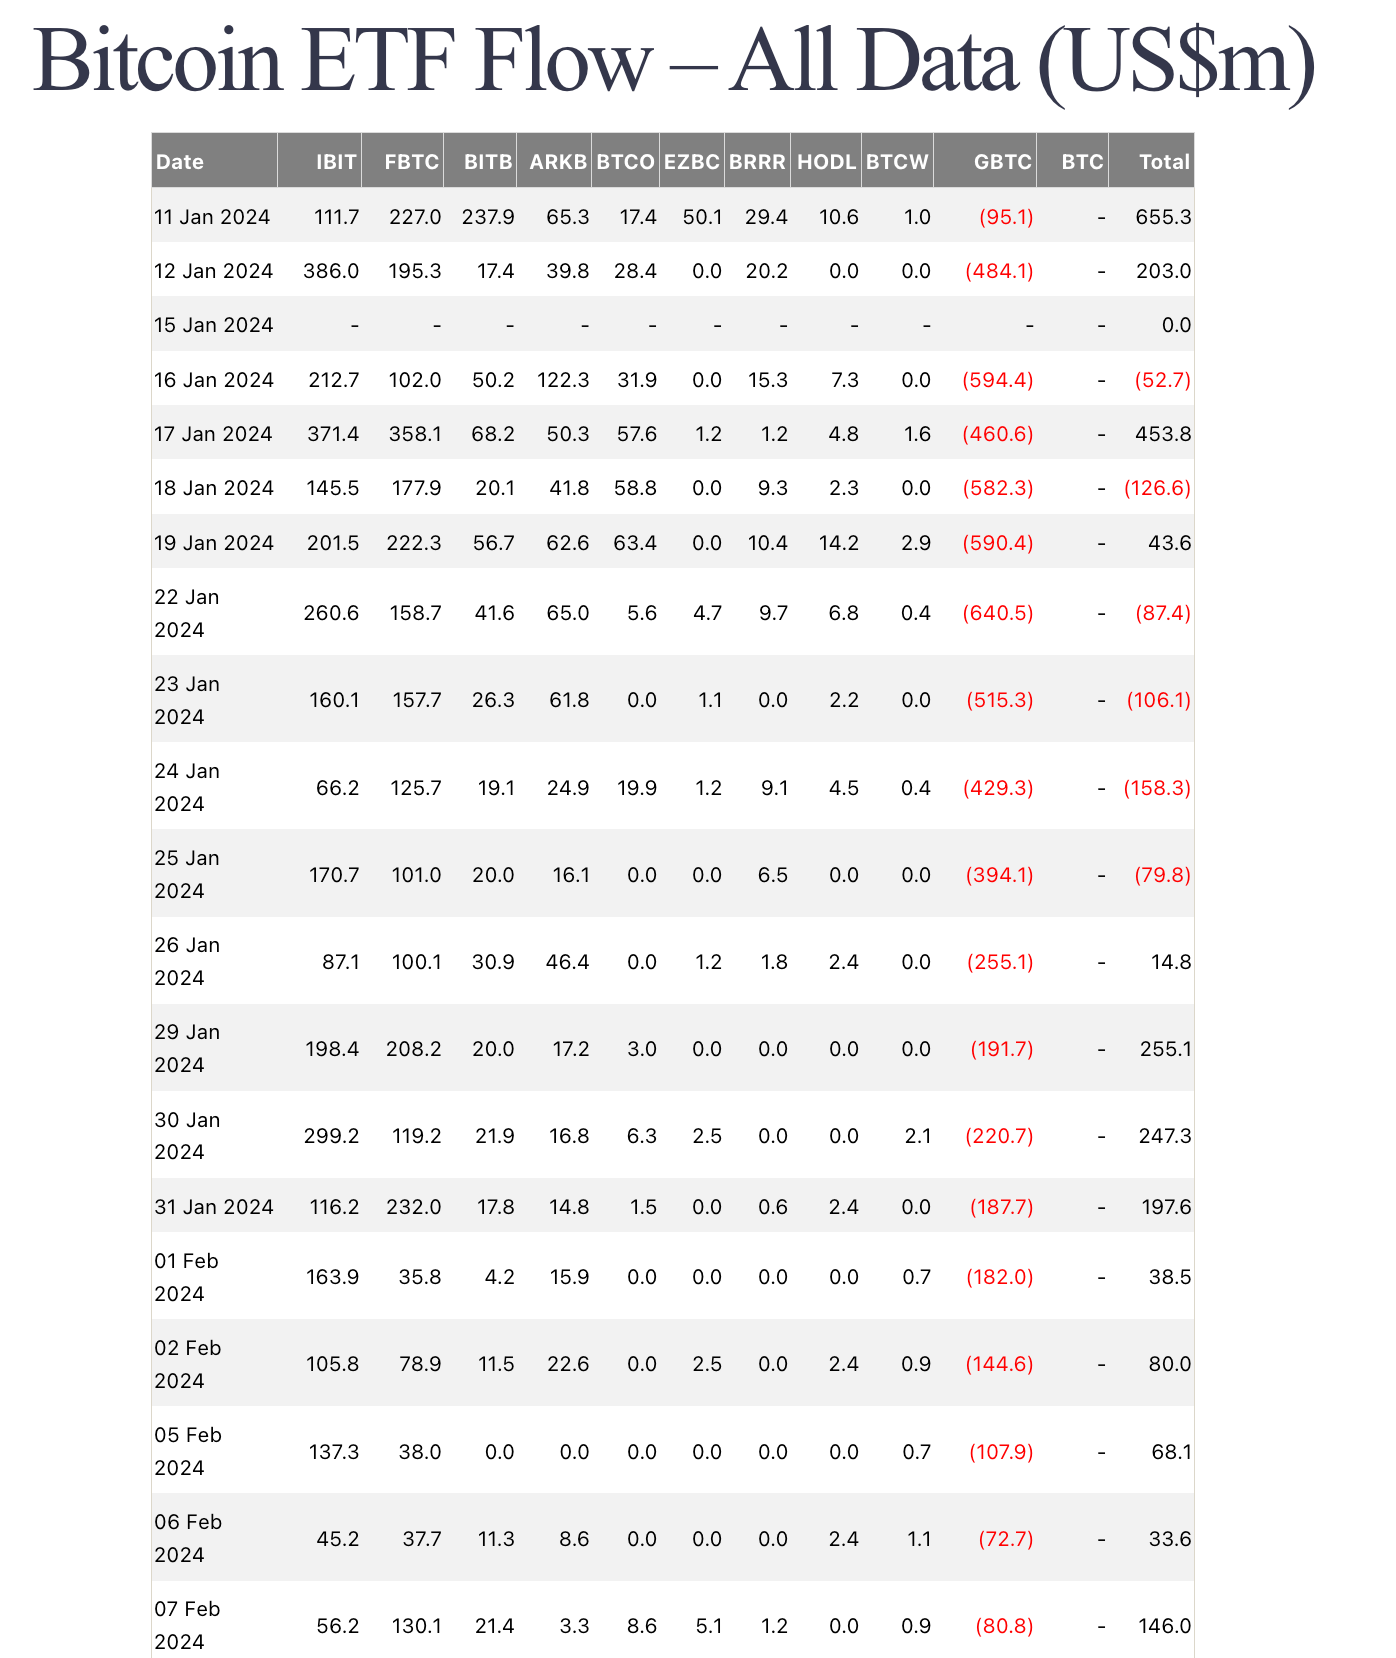
This table shows daily creations and redemptions by issuer. Use the Total column to gauge aggregate demand, then look for streaks over several sessions rather than a single hero print.
How To Reconcile A Day Of Prints
- Start With ETF Netflows: Was there net creation or net redemption.
- Check On-Chain Venue Netflows: Did exchanges see inflows or outflows, is it a one-day burst or a weekly cluster.
- Look At Exchange Reserves: If creations persist and reserves still fall, coins are likely being sourced off-venue or via internal inventory.
- Cross-Check Price Acceptance: If price holds while ETF demand is strong and venues do not show sustained inflows, float is often tighter than the headlines suggest.
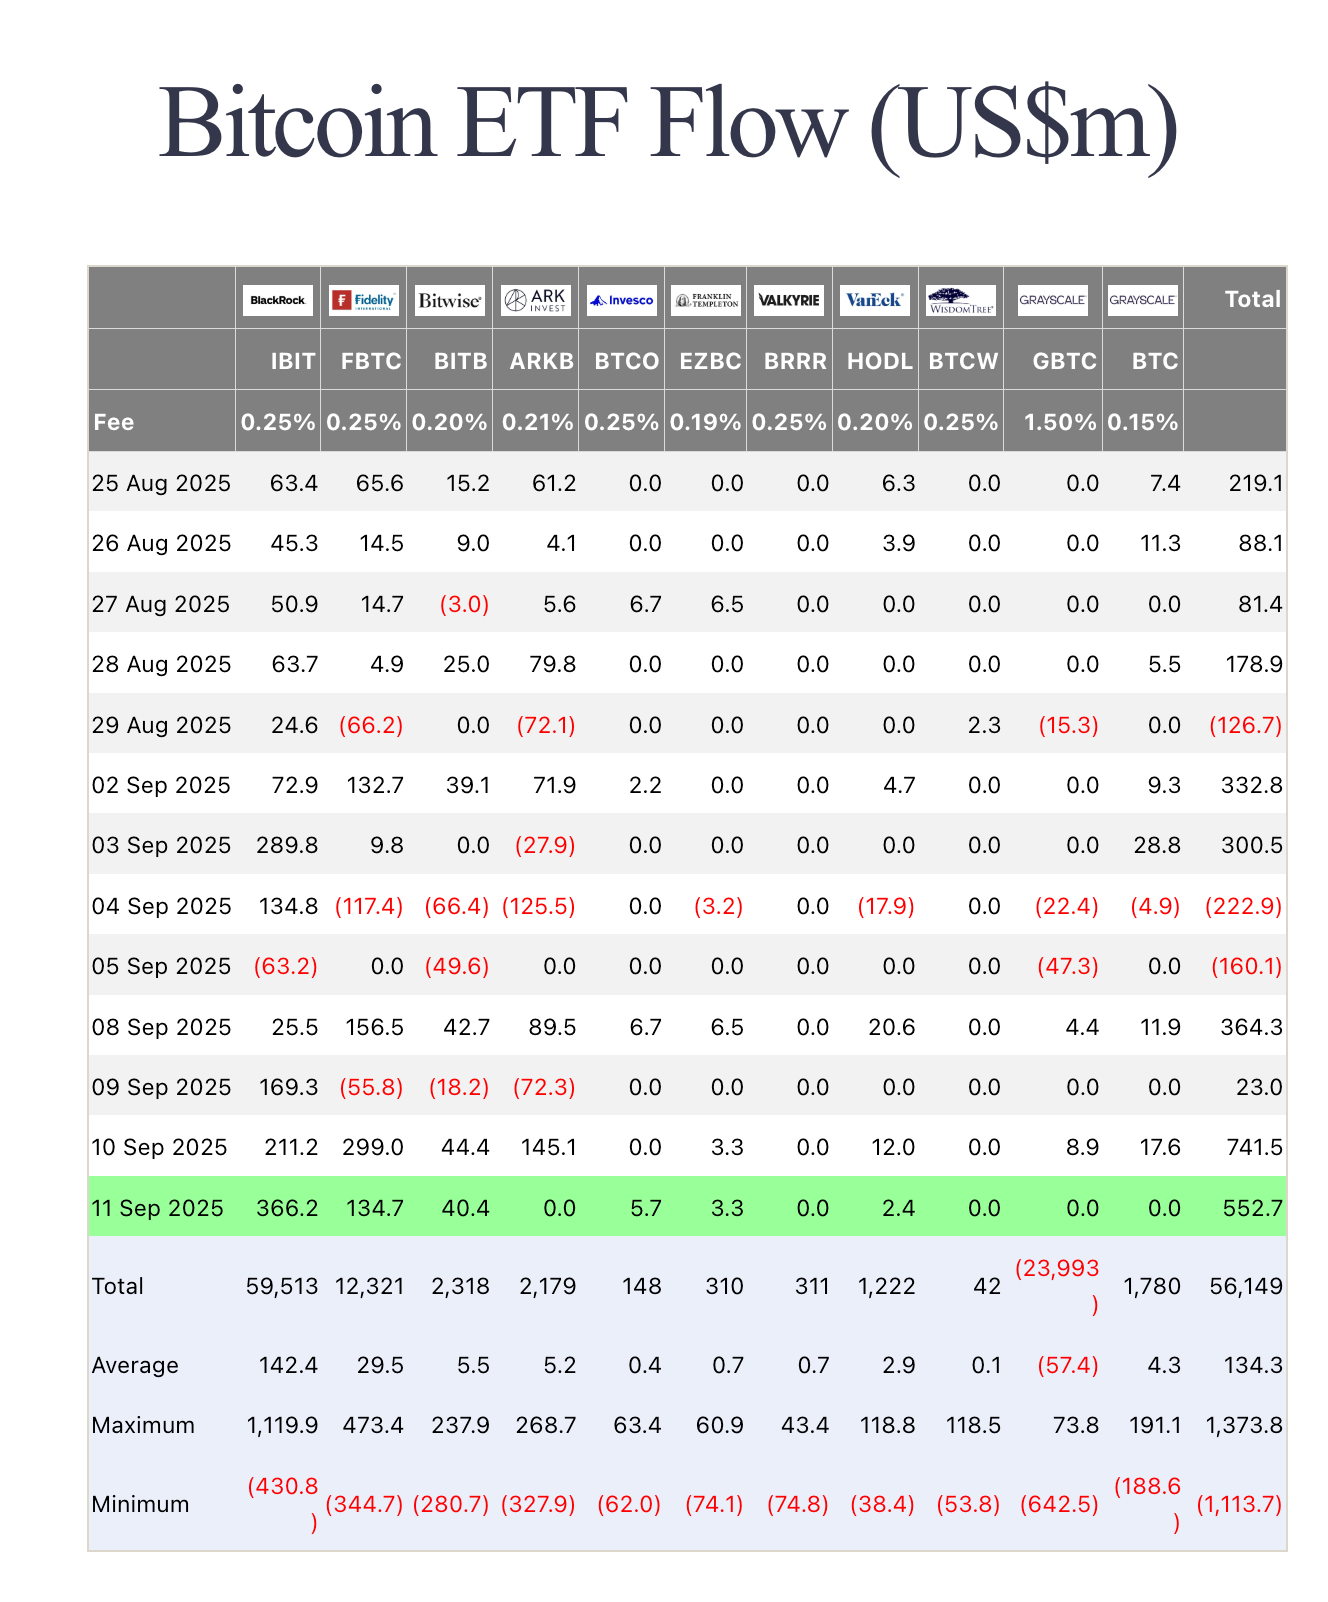
This is a compact window by issuer. What matters most is breadth plus persistence, creations across multiple issuers for multiple days carry more weight than a one-off spike from one fund.
Practical Signals, Guide Rails Not Gospel
- ETF creation streak plus exchange outflow streak: supply is tightening, dips are often cleaner than chasing breakouts.
- ETF creation streak plus exchange inflow streak: supply is being sourced on-venue, expect choppier conditions and more overhead supply.
- ETF redemption streak plus exchange inflow streak: stress window, keep risk lighter until conditions stabilise.
- ETF redemptions while exchange outflows continue: internal netting or off-venue sourcing can mute the impact versus what the ETF headline suggests.
Common Traps To Avoid
This section exists because most bad takes come from treating one day of data as a regime change.
- One-day hero numbers: both ETF sheets and netflow bars can be noisy, act on persistence.
- Wallet reclassifications: step changes in reserves can be tagging updates, read provider notes.
- Assuming ETFs move coins same-day: creations can settle against existing custodian balances, chain moves can come later, or not show up the way you expect.
Pair With Other Dials
- Realised PnL Ratio or SOPR: confirms whether the market is accepting profit-taking while flows arrive.
- CDD or VDD: shows whether older supply is distributing into ETF demand.
- Mayer Bands or the 200-day: frames stretch so sizing and risk decisions are not guesswork.
- BTC dominance (BTC.D): strong ETF demand with rising dominance often tightens conditions for alts.
A Weekly Workflow You Can Reuse
- Log the weekly ETF netflow total and the number of positive flow days.
- Log weekly exchange netflow and the exchange reserves trend.
- If creations persist and reserves fall or stay flat, treat the backdrop as tighter float and plan adds on structured dips.
- If creations persist but reserves rise, treat it as more distribution-friendly and be more selective on strength.
- Review weekly, persistence matters more than daily headlines.
Mini FAQs
Do ETF creations always push price up?
No. If sellers meet demand on-venue or via OTC, price can stall. Acceptance on the market still matters.
Why don’t ETF flows show on my on-chain dashboard?
Because many transfers occur inside custody workflows or via internal netting, and wallet tagging differs between providers.
Which matters more, ETFs or on-chain netflows?
Neither alone. The edge is in reconciling ETF demand with exchange liquidity and profit acceptance.
What is the best confirmation pair for ETF netflows?
Start with exchange reserves and exchange netflows for supply response, then add SOPR or the Realised PnL Ratio for acceptance.
If this helped you reconcile Bitcoin ETF demand with on-chain data, join Alpha Insider for weekly timing windows, dashboards, and member videos.
Alpha Insider members get:
➡️ Kairos timing windows to plan entries before the crowd moves
➡️ A full DCA Targets page with levels mapped for this cycle
➡️ Exclusive member videos breaking down charts in clear, simple terms
This isn’t noise… it’s the full playbook.
Legal And Risk Notice
This guide is for education only and is not financial, investment, legal, accounting, or tax advice. Nothing here is a recommendation to buy, sell, or use any product or service. Cryptoassets are high risk and prices can go to zero. Verify information independently and make your own decisions based on your situation.


Discussion