


Contents
Technical analysis is a very subjective science and where some people laugh at it and don't take it seriously others swear by it and believe it is gospel for stock or crypto trading. One of the more controversial methods is elliott wave theory, many traders use this method to analyse markets and decipher where price will go next. Elliott wave is simply a pattern markets take, first introduced by Ralph Nelson Elliott in the thirties who studied the markets and saw they move in waves and fractals. He saw that a lot of these waves or patterns repeat and can be classified as repetitive price movements to forecast where the markets are likely to go.
The Basic Elliott Waves Principle
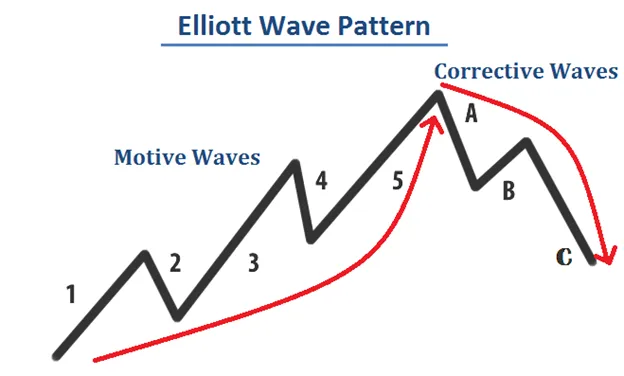
So for a beginner who is getting into elliott wave it may seem daunting as there are so many combinations and methods to read through. I myself have read many books on elliott wave and have put the methods into real life practice but even I at times find it difficult to interpret the wave structures as one eye may look at differently than another. In very simple terms, elliott wave is broken up into two main categories, you have motive or impulsive waves, and then you have corrective waves or structures. Impulsive waves go move in 5's and corrective waves correct in 3's. One of the many misconceptions or confusions in elliott wave theory is that motive or impulsive waves are bullish and corrective waves are bearish.
Motive / Impulsive Waves
There are many combinations for impulsive waves but as this post is meant for beginners we shall just touch the basics of the principle. Impulsive waves follow the main trend, so if in the market price is bullish making higher highs and higher lows then we can consider the wave structure to be impulsive to the up-side. What you will notice is that the wave structure is showing an impulse up with 3 main moves to the upside and 2 corrective waves to the downside as shown in the figure below. Wave 1, wave 3 and wave 5 are the bullish impulsive waves while waves 2 and 4 are corrective waves to the downside but not making new lows. The impulse wave 1, 3 and 5 will have a subdivision of 5 waves within the main wave. So wave 1, 2 and 3 will have 5 smaller waves inside it that you can count on a lower time frame. I know it may sound confusing but it doesn't have to be an exact science as I will discuss later.
General Rules for Impulsive Waves
There are a few rules to consider when looking at impulsive waves and as a general rule of thumb wave 3 cannot be the shortest wave and wave 4 cannot go down into wave 1 territory. Also, wave 2 cannot re-trace below that start of wave 1. The impulse waves usually follow the 5-3-5-3-5 pattern.
Corrective Waves
So this concept in elliott wave theory is opposite to what we would expect after we see the motive wave, and these waves correct or retrace a bullish impulse wave. Depending on which wave your are seeing these corrective waves can com in many forms and sometimes even in long-drawn-out complex corrections. For this post we will simply look at the basics for elliott wave theory and look at the most basic types of corrective waves.
How to identify Corrective Waves
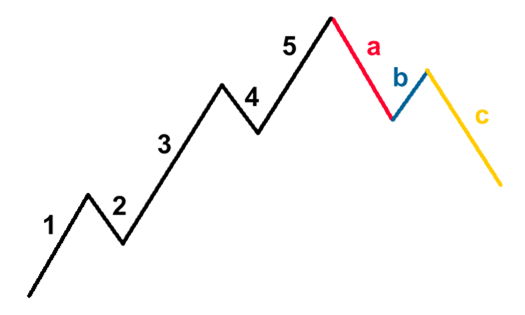
In Elliot wave theory you can identify a corrective wave by the shape and the fact they move in the opposite way to the main trend of the market. Corrective waves move in 3's and normally consist of an, a wave, b wave and a c wave. Each of these waves will have a series of sub waves that will vary in counts depending on the overall elliott wave correction pattern you encounter.
Fibonacci and Elliot wave
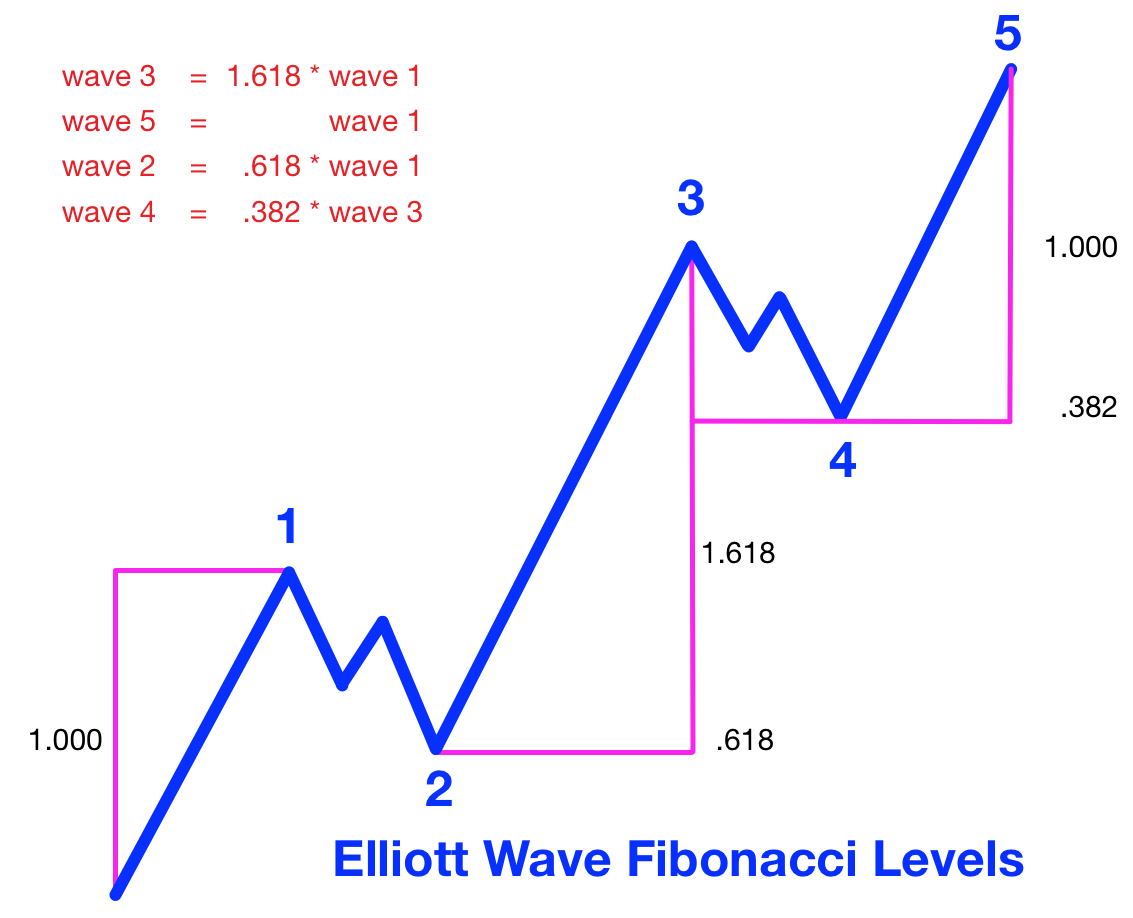
I won't go into the detail of every Fibonacci retracement and extension number regarding elliott wave, however, note that fibonacci plays a key role in determining where price is likely to go or retrace to. Once you have an initial wave structure you can use the fibonacci extension tool to determine where a wave may end. On the flip side you can also use the fibonacci standard tool to try and figure out where a sub-wave may end. The common fibonacci percentages that elliott wave uses are the 38.2%, 50%, 61.84. 76.4%, 161.8% and the 200%. Depending on which wave you are looking at there are several fibonacci percentages that you may use to analyse the market.
Common Corrective Patterns
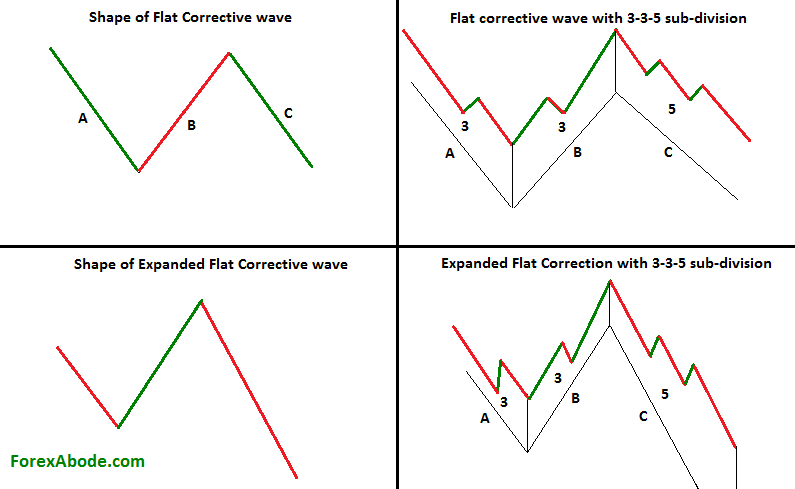
In elliott wave theory there are many patterns to identify corrections and some can get really complicated and difficult to interpret. The most common type of corrections are "flat" patterns which show 3 waves in the market opposite to the main trend. After an impulse wave you will get an A wave which goes in the opposite direction to the trend and then a B wave which goes back into the direction of the main trend and then finally a C wave that usually breaks below the support of the A wave against the main trend. There are many variations to flats where the most common are running and expanded flats. Another pattern that is very common are triangles, you can see many forms of these occurring in corrections such as descending, ascending and symmetrical triangles.
Is Elliott Wave Useful?
As I mainly look at the crypto market there are many many ways to do technical analysis, some analysts do not touch elliott wave while others use it exclusively. I have studied elliott wave in quite some detail and do think it has its advantages, for instance, looking at the larger timeframes it is easy to spot whether you are in a corrective or impulsive trend. Furthermore, it can give you a sense of what is about to happen in the market so you can be prepared for future moves in bull and bear markets. However, the main disadvantage that I have experienced with this theory is that a number of technicians can have very different views on the market and price movements. It can be very subjective depending on what the bias is of a particular analyst and what they are seeing in the market. You can have two excellent analysts giving two totally different forecasts and both can have valid reasons for their views. This can make it increasingly hard for beginners and novices to determine which is correct and further aid to his or her confusion.
The Bottom Line
I believe Elliott Wave Theory can be a useful tool to help understand the phases of a market and can give you insight into price movements. However, I wouldn't solely rely on this as the only method of technical analysis and incorporate it with other aspects such as support and resistance and volume confirmation. I would also be careful of spending too much time analysing the waves and subdivision of every price movement as this can become very counterproductive.
Useful Books
The Wave Principle - by Ralph Nelson Elliott
Technical Analysis Articles
The Investors Secret Weapon - Learn how to use the Coppock Curve


Discussion