


The 13 EMA and TD Sequential can help readers organise crypto swing behaviour by asking two different questions at the same time. The 13 EMA helps describe short-to-medium trend rhythm because it reacts more quickly to recent price than an SMA, while TD Sequential helps describe where a move may be becoming stretched or vulnerable to exhaustion. Used together, they can make a chart easier to read. Used carelessly, they can create false confidence. The right way to use them is as context, not as certainty, and never as a mechanical promise that a move must continue or reverse.
What The 13 EMA And TD Sequential Are
The 13 EMA and TD Sequential are two different chart tools that try to describe two different parts of market behaviour. The 13 EMA is a moving average that reacts more heavily to recent prices, while TD Sequential is a count-based indicator created by Tom DeMark to describe trend development and possible exhaustion.
Neither one tells you what price must do next, but both can help organise the chart when used carefully.
The old TMU article used these tools inside a more strategy-framed piece about larger Bitcoin and crypto swings. This revamp keeps the educational core, especially the idea of using the 13 EMA for trend rhythm and TD counts for exhaustion context, while removing the older trade-instruction framing.
For quick definitions of related terms, use the Crypto Dictionary.
What The 13 EMA Is
An exponential moving average, or EMA, is a moving average that places greater weight on more recent price data. That makes it more sensitive to current movement than a simple moving average, or SMA, which weights all observations equally.
For beginners, the easiest way to think about the 13 EMA is that it is a faster-moving average line that hugs price more closely than a slower or less responsive average. That makes it useful for describing shorter swing rhythm, but also easier to shake around in choppy crypto conditions.
Why The 13 EMA Is Used As A Shorter Swing-Context Moving Average
The number 13 is not magic. It is simply short enough to stay closer to recent price, while still giving the reader some smoothing across multiple bars.
In practice, many chart readers use a 13 EMA because it is more responsive than longer averages and can help frame the rhythm of multi-bar swings without becoming as fast and noisy as very short moving averages.
That is why the 13 EMA can be useful in swing-context work. It is not there to predict. It is there to help you see whether price is still moving in a way that broadly respects recent trend rhythm or whether that rhythm is fading.
What An EMA Measures Versus An SMA
Both EMA and SMA are moving averages built from past price data, but they behave differently. An SMA gives equal weight to every data point inside the chosen period, while an EMA gives more weight to the most recent data. That is why an EMA usually reacts faster to fresh price movement and an SMA usually looks smoother but slower.
This faster response is useful, but it comes with a trade-off. Because the EMA is more sensitive, it can also create more short-term distortion in volatile conditions. That is especially relevant in crypto, where fast swings can make a shorter EMA look more meaningful than it really is if the wider chart is still messy.
| Tool | What It Measures | Beginner Caution |
|---|---|---|
| 13 EMA | A faster moving average that reacts more to recent price. | Useful for rhythm, but still lagging and sensitive to noise. |
| SMA | A simple average that weights all values equally. | Smoother, but slower to react. |
| TD Sequential | A count-based framework for trend progression and exhaustion context. | Counts can appear without producing clean reversals. |
Why Price Behaviour Around The 13 EMA Can Help Describe Trend Rhythm
Price behaviour around a shorter EMA can help show whether a move is progressing in an orderly way or becoming more unstable. If price is repeatedly regaining the average after pullbacks, that can suggest trend rhythm is still constructive. If price keeps slipping through it and failing to reclaim it cleanly, that can suggest the rhythm is becoming weaker or less reliable.
The important correction is that the 13 EMA does not create the trend. It only helps describe it. Price still comes first. The moving average is one reading layer built from past data.
Why The 13 EMA Does Not Predict Price
Because the EMA is based on historical price data, it is inherently lagging. Even though an EMA reacts faster than an SMA, it is still built from what has already happened.
That means a close above or below the 13 EMA should never be treated as self-contained proof. It may matter, or it may only reflect short-term movement inside a larger structure that still looks unresolved.
What TD Sequential Is At A Beginner Level
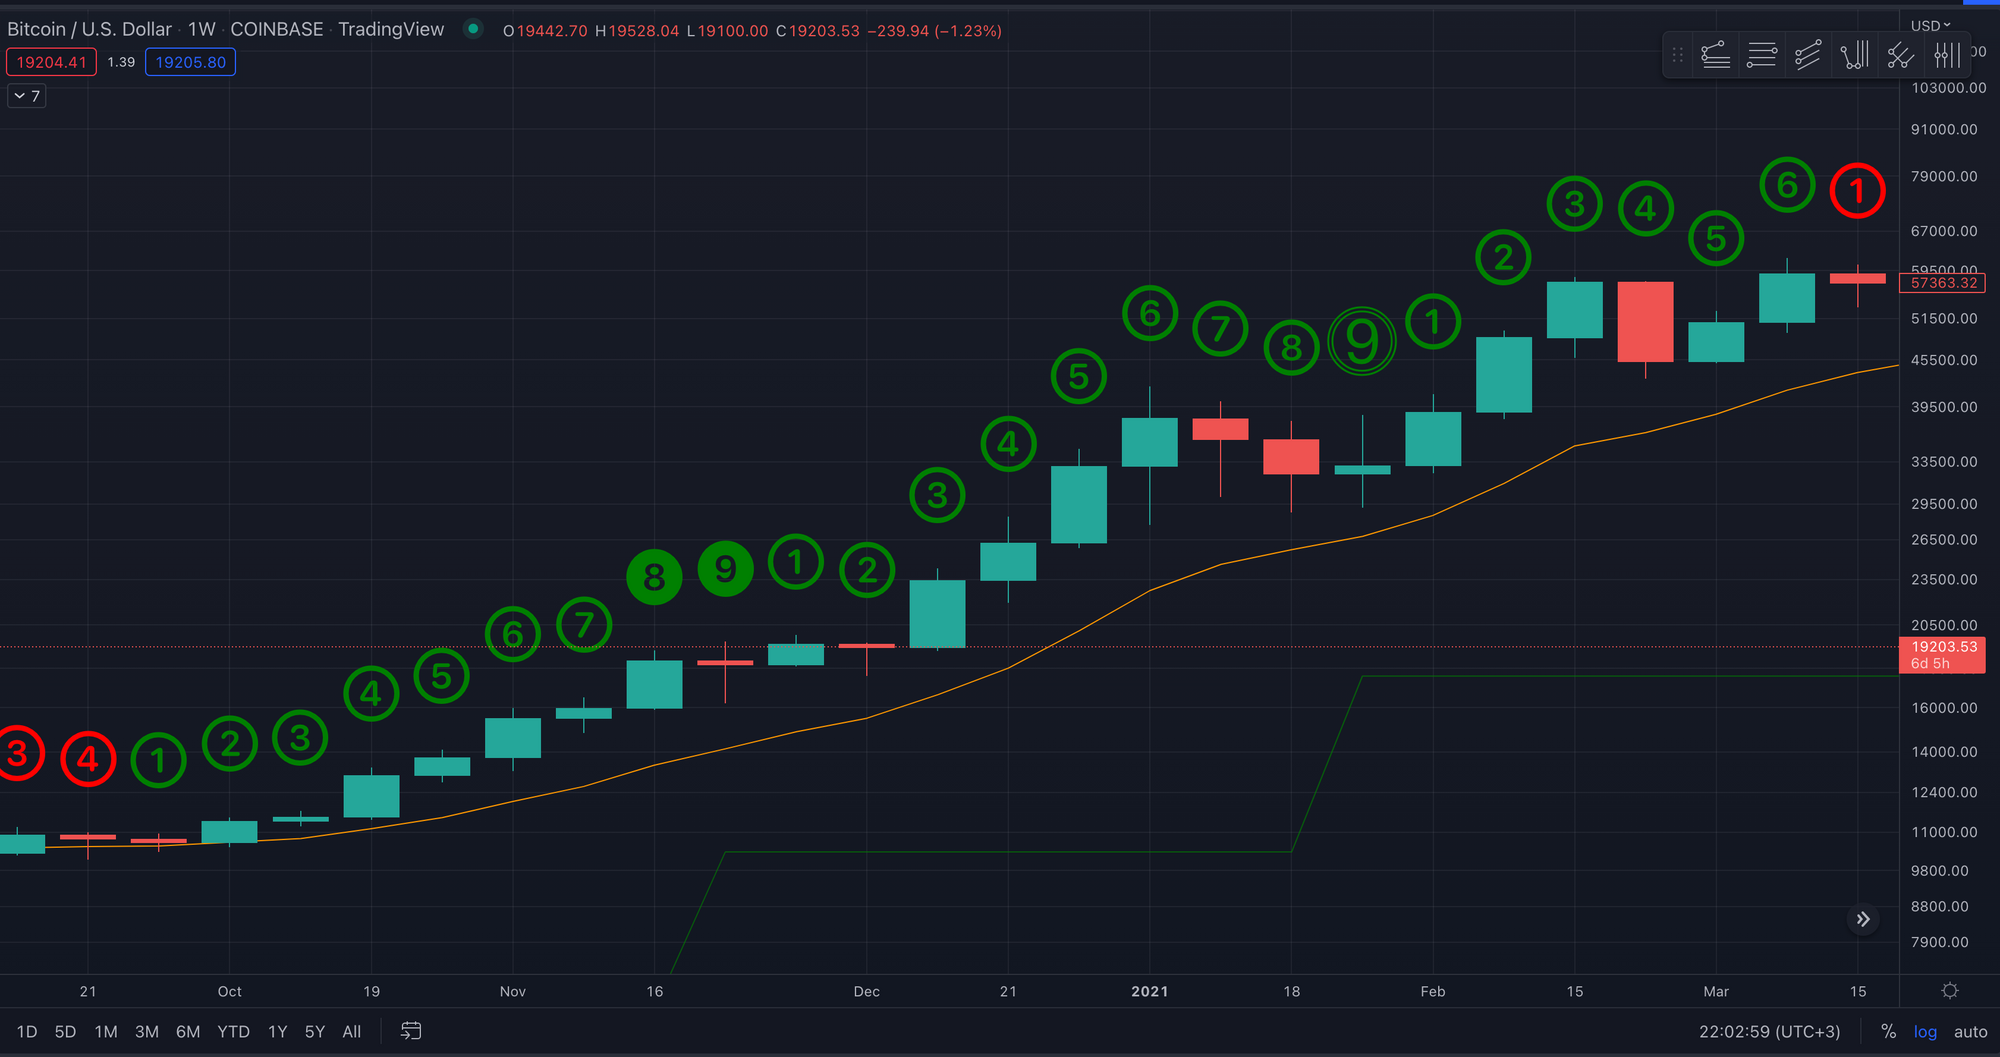
TD Sequential is a Tom DeMark indicator designed to analyse trend development and possible exhaustion through a multi-phase counting process. The framework is commonly discussed around a Setup phase and a Countdown phase, often associated with 9 and 13 readings.
At a beginner level, the simplest way to understand it is this: TD Sequential is not a moving average and not a momentum oscillator. It is a counting framework that tries to describe where a trend may be progressing, becoming stretched, or approaching an area where reversal risk becomes more relevant.
What TD Sequential Counts Are Trying To Describe
TD Sequential counts are trying to describe trend progression and possible exhaustion. A 9-count Setup can suggest a move has developed across a sequence of bars. A 13-count Countdown is often discussed as a more mature exhaustion-style condition.
For a beginner, the practical takeaway is not memorising every rule. It is understanding that the numbers are trying to describe trend progression and possible exhaustion, not hand out instructions. Repeated counts can frame the stage of the move, but they do not command the market to turn.
Why TD Sequential Can Be Useful For Exhaustion Context
TD Sequential can be useful because many strong moves do not end all at once. They often progress through phases of strength, persistence, hesitation, and eventual fatigue.
That is why the tool can help frame exhaustion context on a chart. It gives the reader a way to ask whether the move still looks early, mature, or stretched. But that is all it does. It improves description, not certainty.
Why TD Sequential Does Not Guarantee Reversal
A TD 9 or TD 13 can be useful as an exhaustion warning, but neither one forces reversal. Strong trends can ignore counts for longer than readers expect, especially in crypto.
This is exactly why TD Sequential needs careful public framing. The count can make the chart more interesting, but it does not settle the chart on its own.
How The 13 EMA And TD Sequential Can Be Read Together
These two tools can work together because they describe different things. The 13 EMA helps frame trend rhythm and relative price position. TD Sequential helps describe how extended or mature a move may be becoming.
When both are used together, the chart reader is not asking for a mechanical answer. The chart reader is asking whether the move still looks structurally healthy, increasingly stretched, or more vulnerable to a pause or reversal.
The old TMU article used this combination in a much more rules-based way, with language around where to act and how to manage the position afterward. This public explainer keeps the chart-reading logic but deliberately removes that instructional layer.
Why Multiple Tools Should Not Be Treated As Certainty
Using two tools instead of one does not magically remove uncertainty. A shorter EMA can still be noisy. TD counts can still fail. If both appear to agree, that may make the chart more interesting, but it does not create certainty or a reliable system.
That is an important beginner discipline. Confluence can improve context, but it does not guarantee reaction.
How Crypto Volatility Affects 13 EMA And TD Readings
Crypto volatility can distort both tools. A shorter EMA can be dragged around by fast price swings, while TD counts can keep progressing inside moves that feel stretched long before price actually changes character.
That makes crypto a particularly difficult environment for anyone who wants indicator readings to behave neatly.
This is one reason historical examples are helpful. They let readers see how the tools behaved in real Bitcoin conditions, not just in textbook sketches.
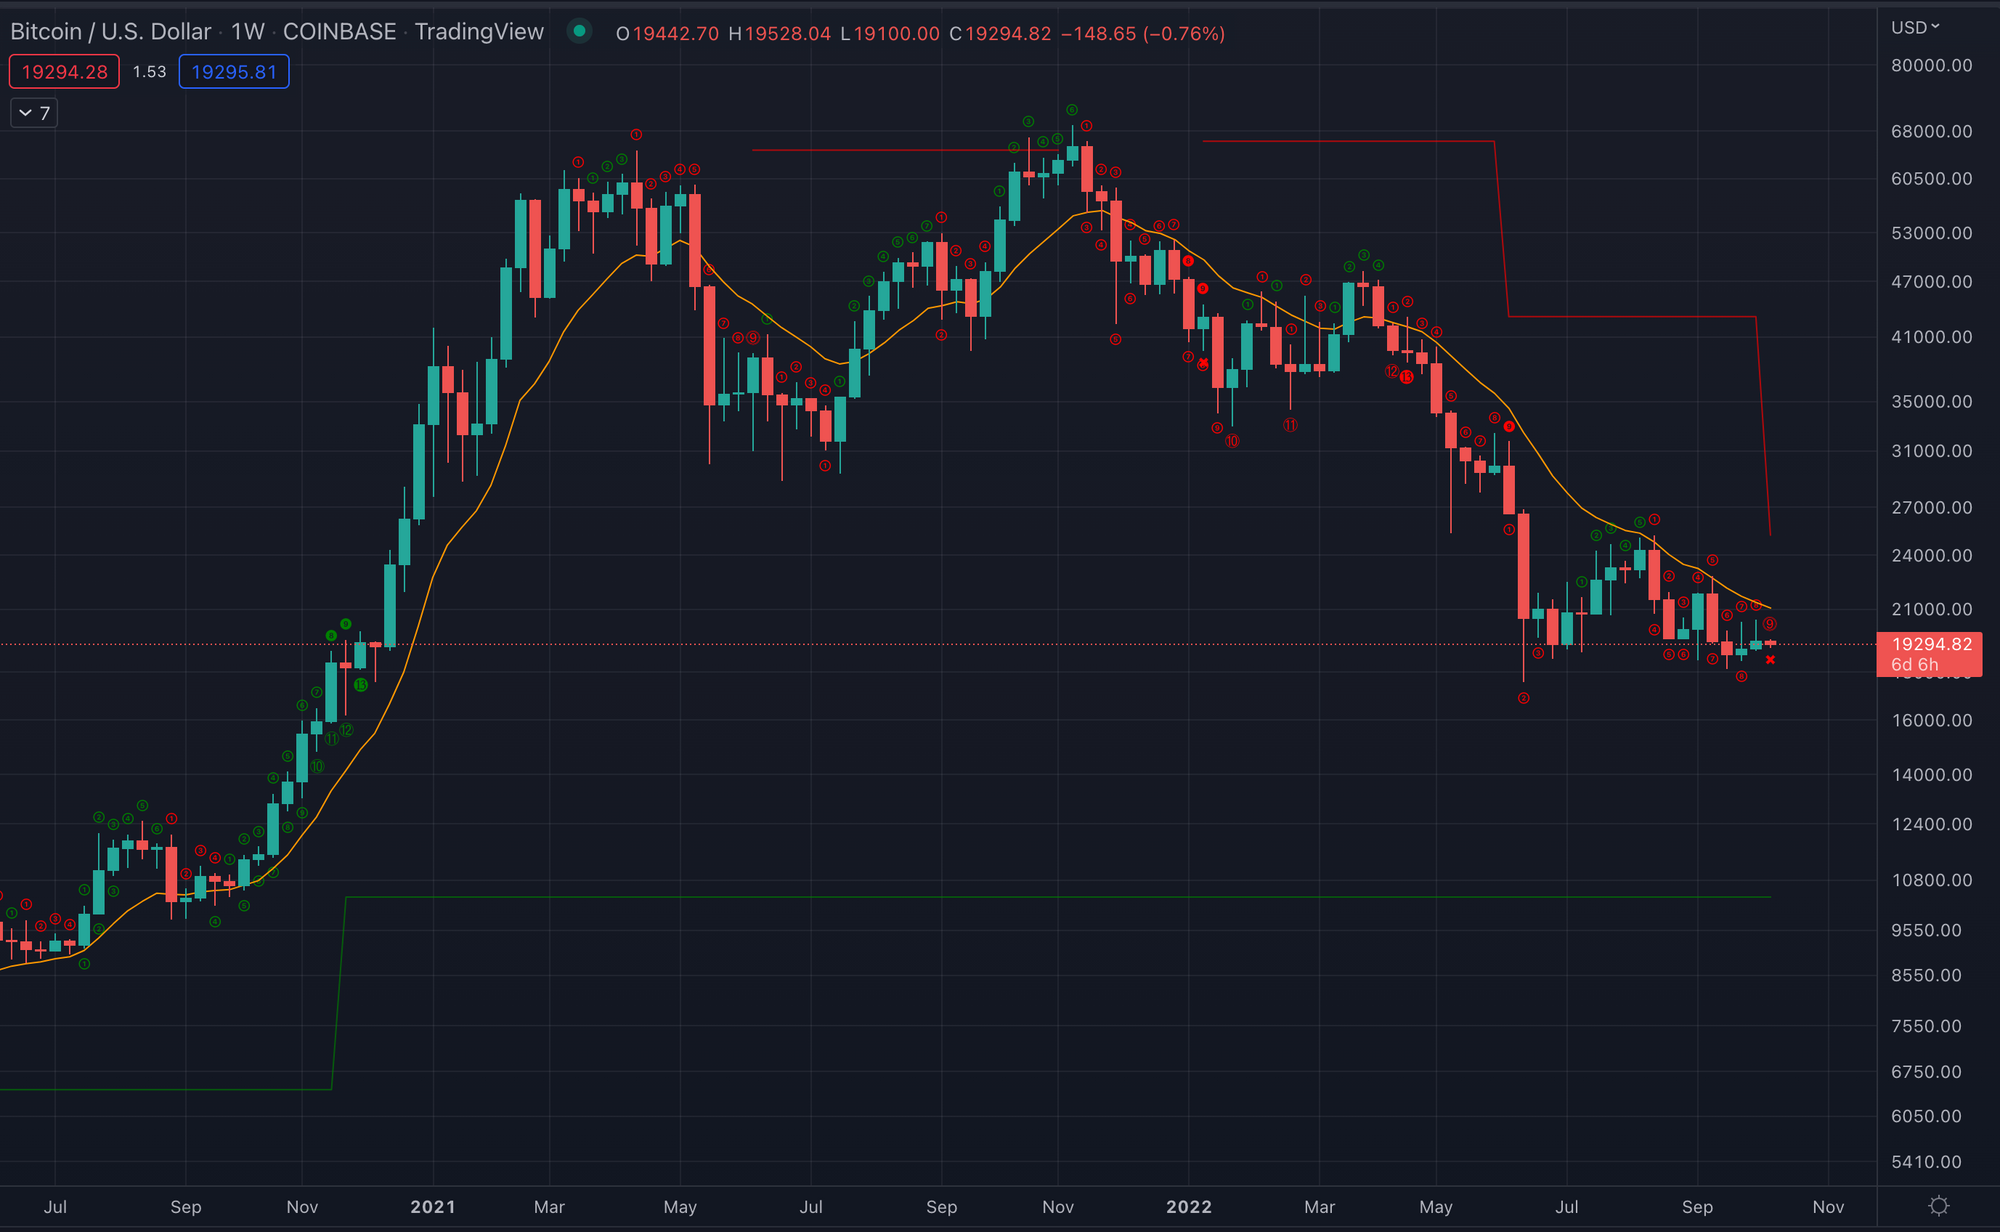
Why Timeframe Matters, Especially Weekly Examples
Timeframe matters because both moving averages and count-based tools change their meaning depending on the chart scale. A weekly 13 EMA reflects a very different kind of trend rhythm from a daily or intraday 13 EMA. A weekly TD count also reflects a much longer swing progression than a lower-timeframe count.
The old TMU article focused heavily on weekly Bitcoin examples for exactly this reason. It was trying to frame multi-week and multi-month swing behaviour rather than chase very short-term movement. That makes the examples useful as historical education even after the strategy framing is removed.
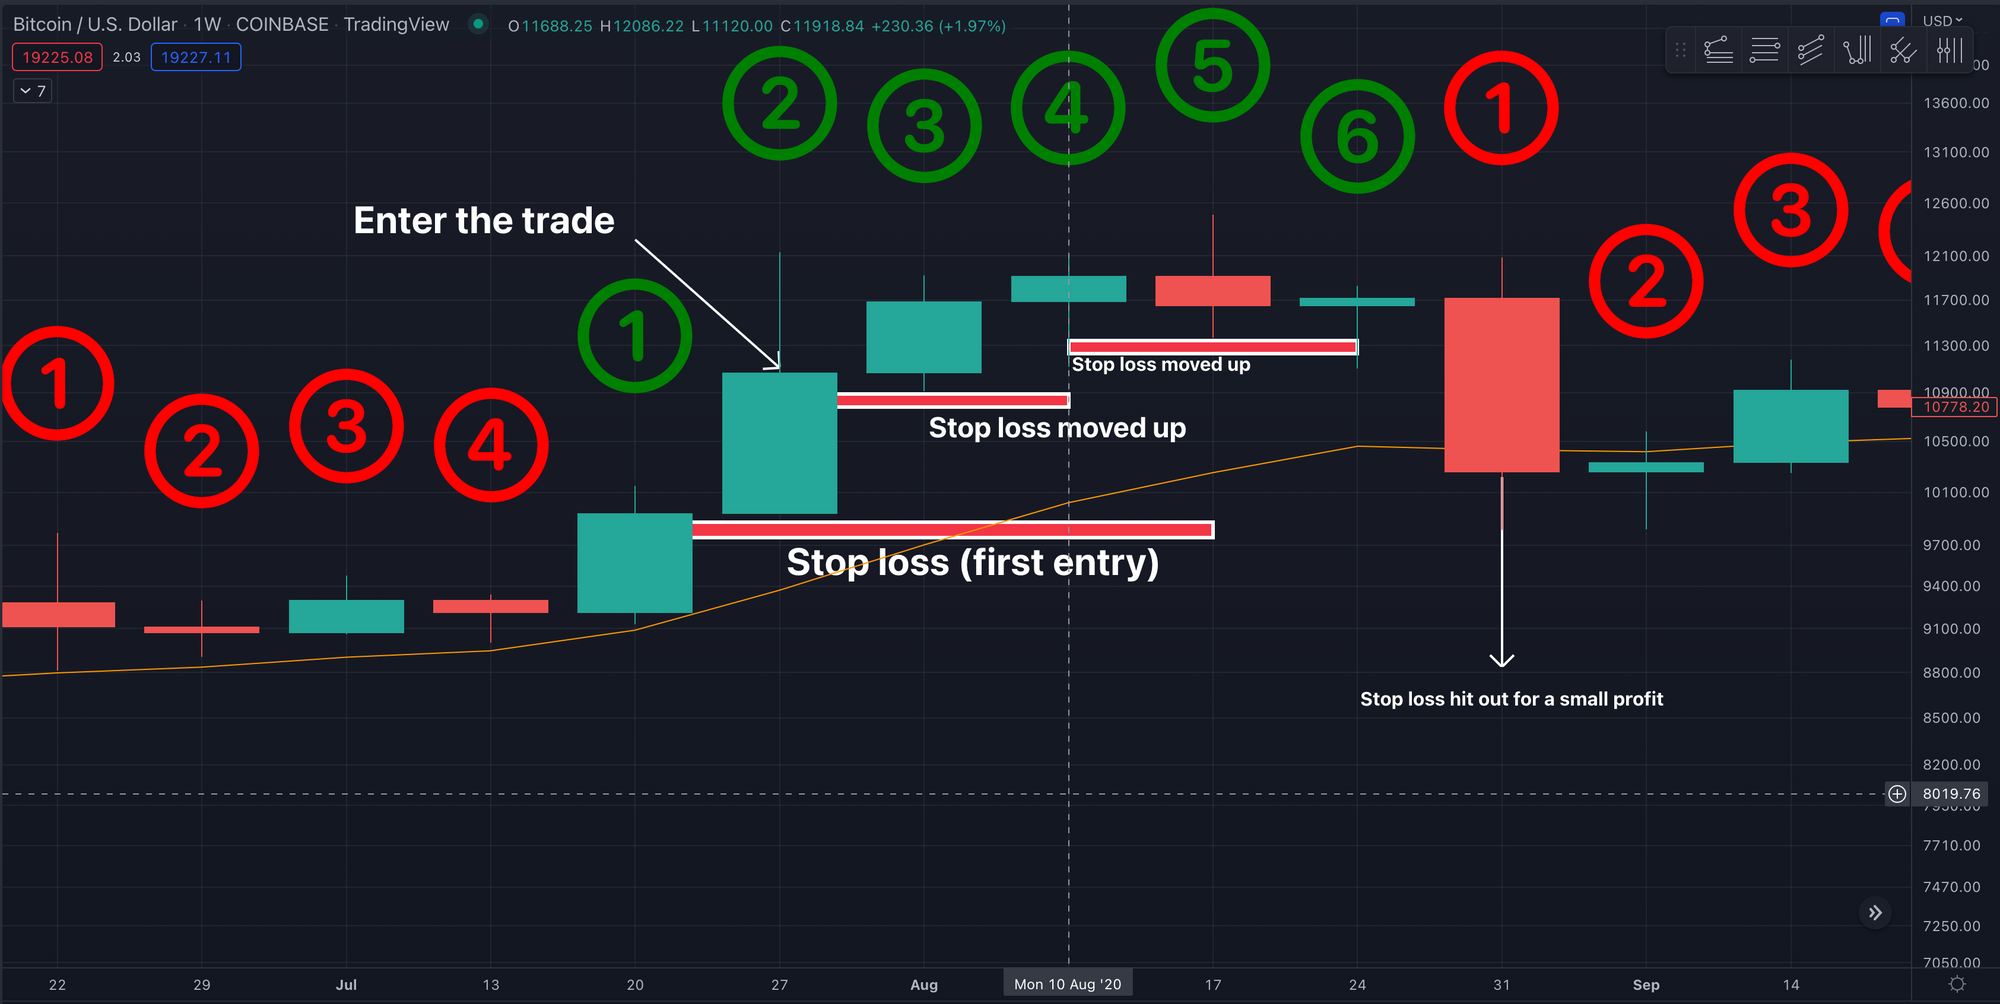
Why Historical Examples Are Useful But Not Repeatable Templates
Historical examples are useful because they help readers see how the tools behaved during real market phases, including trends, pauses, resets, and exhaustion conditions. They can show what the chart was revealing at the time more clearly than a purely abstract explanation.
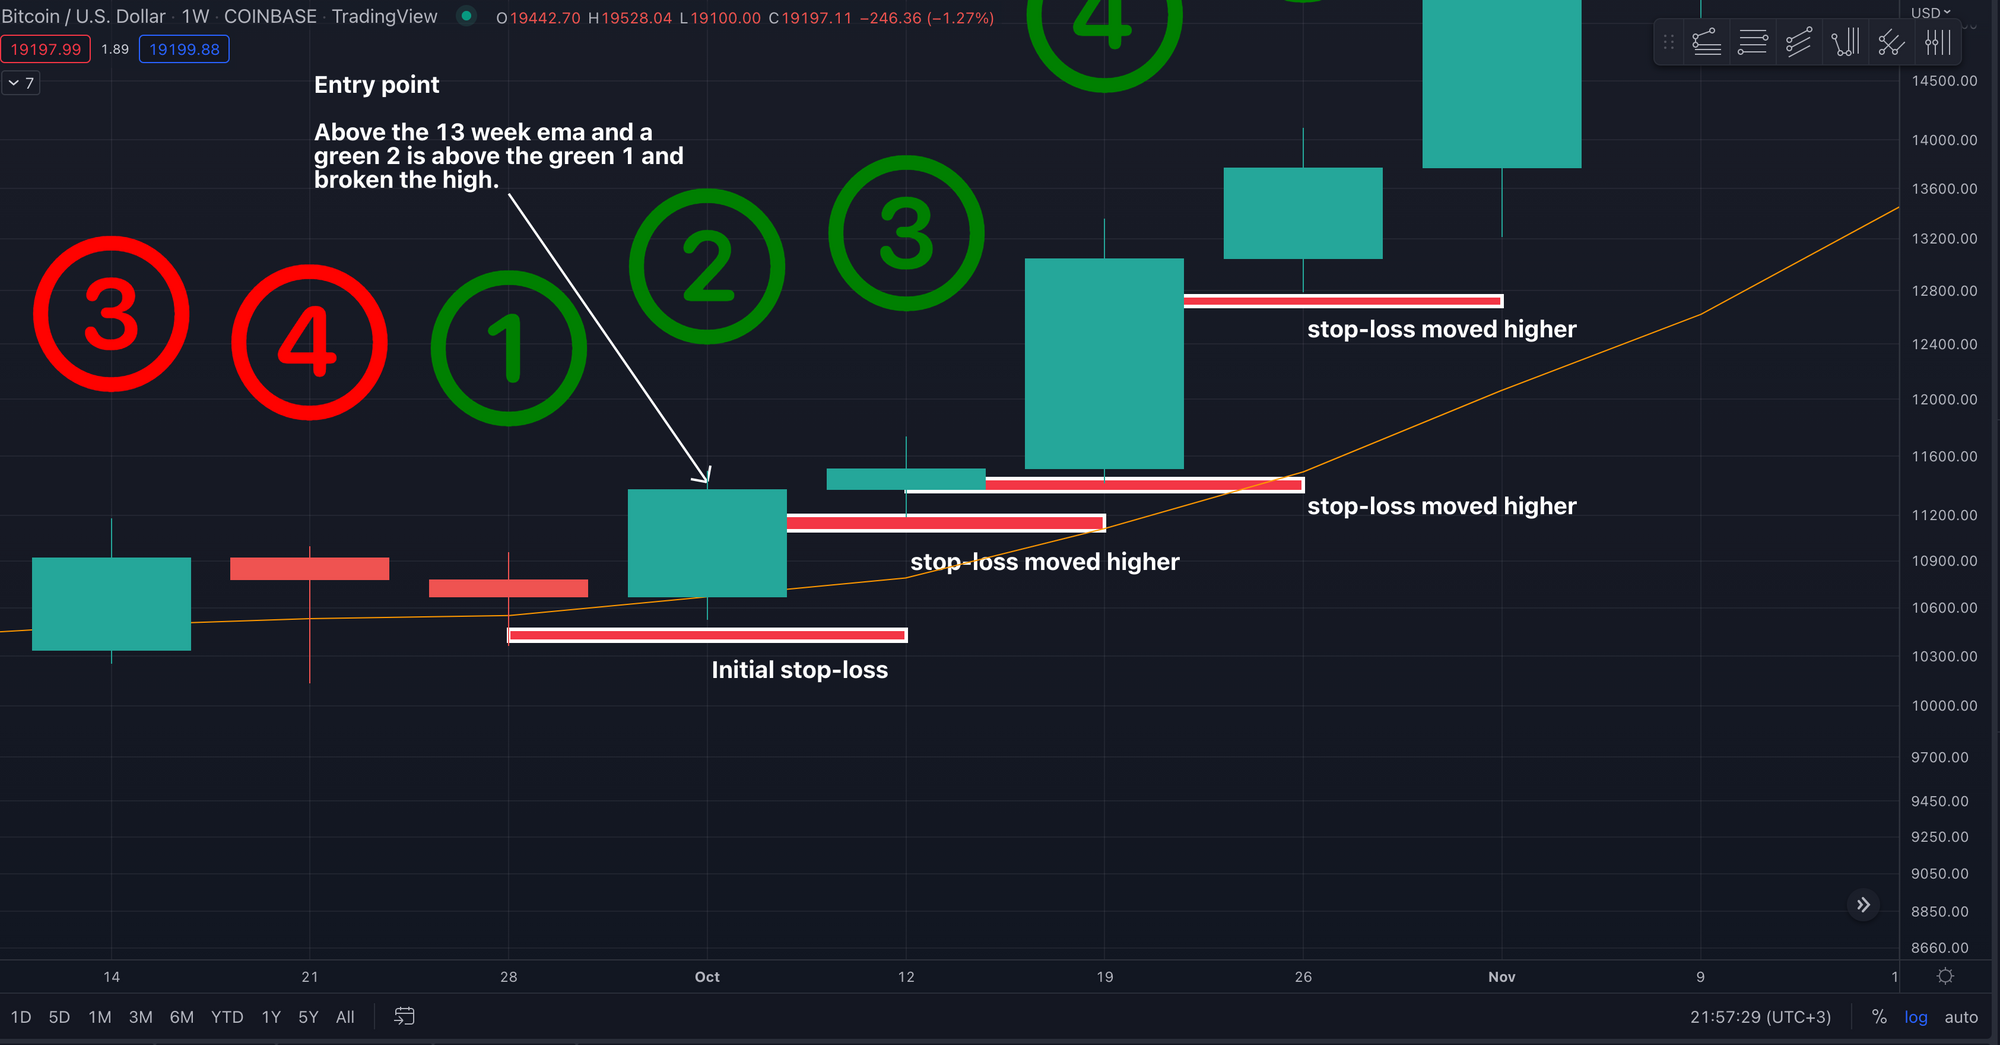
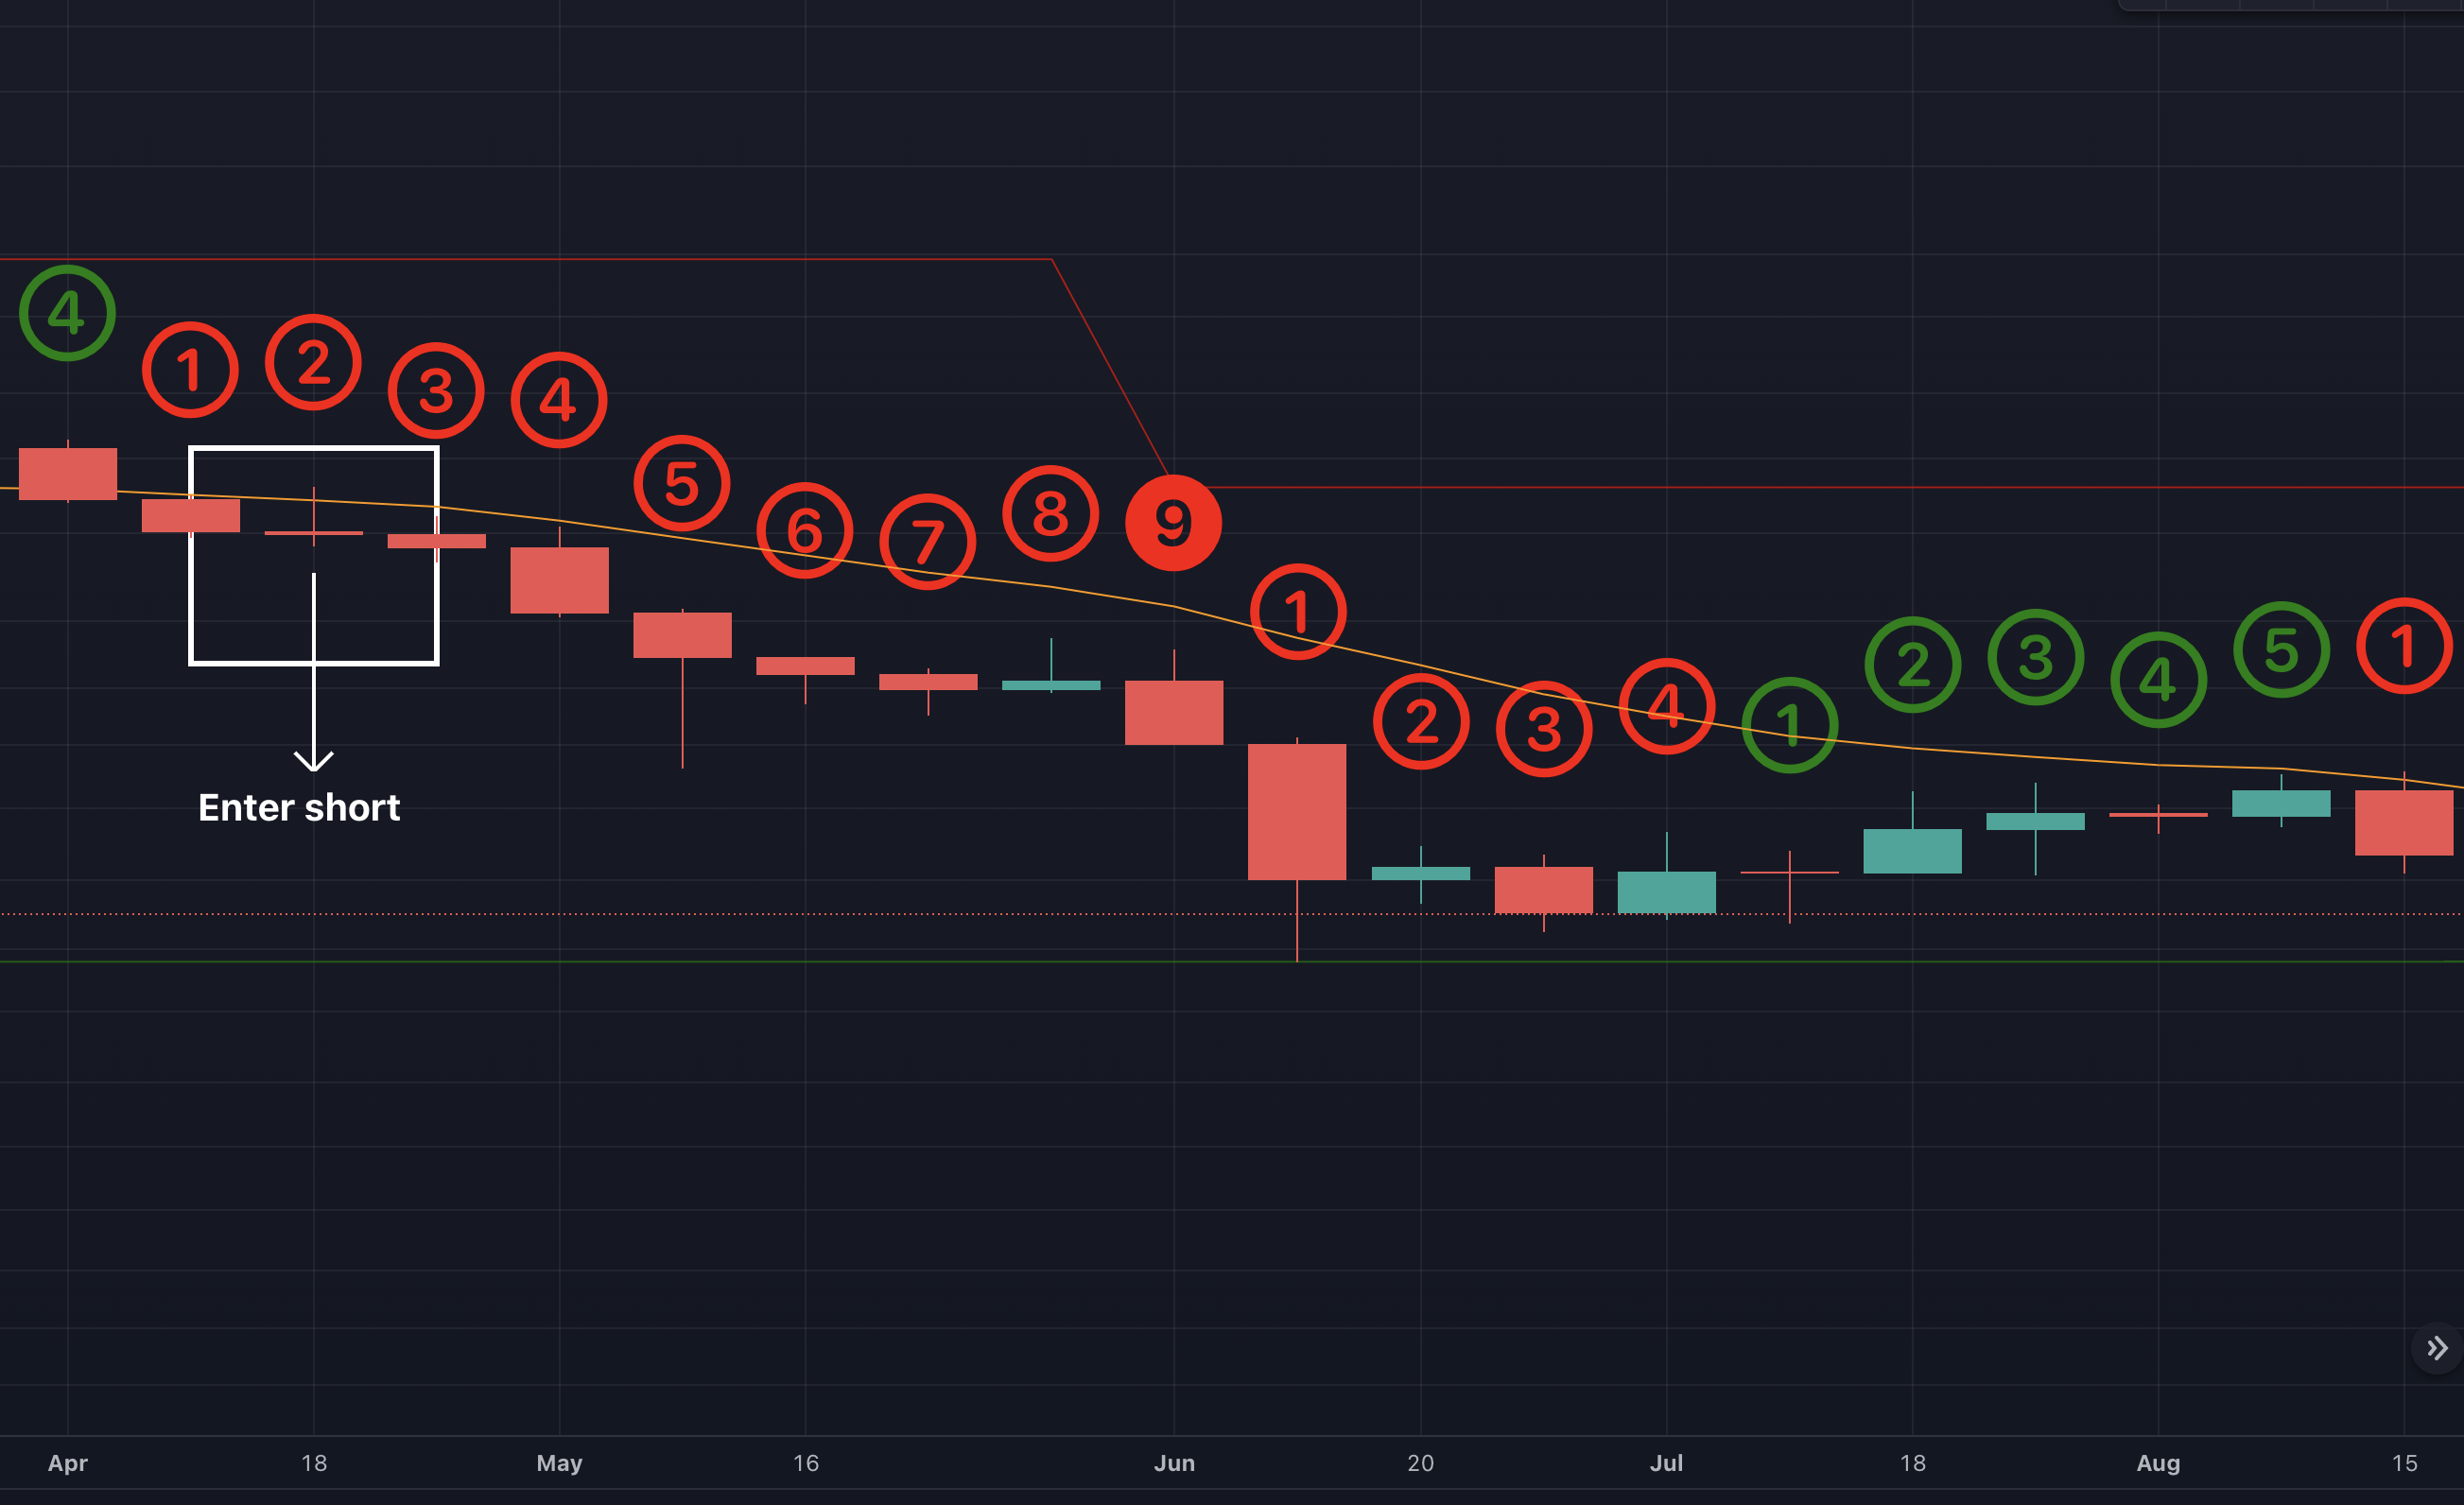
But historical examples are not templates to copy. The market does not repeat in a mechanically identical way, and the old annotations in these charts often include words like entry or stop-loss because they came from a strategy-framed article.
In this public explainer, those annotations should be read as part of the original historical teaching format, not as present-day instructions.
How This Method Connects To Market Structure
The 13 EMA and TD Sequential become more useful when they are read inside market structure. If the chart is making higher highs and higher lows, a shorter EMA and bullish count progression may describe trend rhythm differently than they would inside a weak range or a damaged structure.
The tools do not replace structure, they sit underneath it. That is why structure should always come first. The indicators help explain the swing. They do not define the whole chart on their own.
How This Method Connects To Support And Resistance
Support and resistance help show where the market has already reacted. The 13 EMA can sometimes act as a dynamic trend reference, but a horizontal reaction area often carries more direct chart memory than a moving average.
TD counts can make a support or resistance approach more interesting if the move already looks mature, but they still do not guarantee a response. The EMA and the counts add context around the level, not certainty at the level.
How This Method Connects To RSI
RSI measures momentum differently from TD Sequential. RSI tracks the speed and magnitude of price changes, while TD Sequential tracks exhaustion through a count process. The 13 EMA then adds a trend-rhythm layer on top.
When read together, these tools can help readers ask whether price is stretched, whether momentum is still strong, and whether the trend rhythm still looks in place. But again, more tools do not create more certainty by default. They only create a richer chart reading if the broader structure is already clear.
How This Method Connects To Candlestick Behaviour
Candlesticks show what happened inside each bar. The 13 EMA and TD counts show the broader rhythm around those bars. A strong rejection candle near the EMA, or around a mature count sequence, can become more interesting than the candle alone. A random candle in noisy context may not.
So the candle still matters, but it matters more when it appears inside meaningful context rather than in isolation.
Common Beginner Mistakes
A common mistake is treating the 13 EMA like a mechanical line that must be respected. Another is treating a TD 9 or TD 13 like a guaranteed reversal point. Others include ignoring timeframe, forcing the tools onto noisy charts, and assuming that using both together creates a dependable system.
Another major mistake is reading the old annotated charts as current instructions. In this article, the annotations are part of historical teaching material only. They show how the method was once framed, not what the reader should do now.
What 13 EMA And TD Sequential Can And Cannot Tell You
These tools can help describe trend rhythm, swing progression, momentum persistence, and exhaustion risk. They can help you see whether a move still looks orderly, increasingly stretched, or more vulnerable to a reset. They can also make historical swing examples easier to read.
What they cannot do is guarantee reversal, continuation, or safety. They cannot tell you that price must reverse at a 9 or 13, that a close above or below the 13 EMA settles the chart, or that using both together produces a reliable system. They improve context. They do not remove uncertainty.
| They Can Help With | They Cannot Guarantee |
|---|---|
| Reading trend rhythm. | That price will continue in the same direction. |
| Spotting possible exhaustion context. | That a reversal must follow. |
| Studying swing progression across timeframes. | That an old historical pattern will repeat. |
| Adding structure to chart review. | That the method creates a reliable system. |
A Step By Step Educational Reading Process
Start with the higher timeframe chart first, especially if the goal is to understand larger swing behaviour rather than noise. Then ask what market structure looks like before you add any indicators. After that, place the 13 EMA on the chart and observe whether price has been moving around it in a way that still looks orderly or increasingly unstable.
Next, look at TD Sequential counts and ask what stage of progression the chart may be showing. Are counts building inside a strong trend, clustering in a choppy area, or appearing near a mature swing that already looks stretched?
Then compare that reading with support and resistance, RSI if it helps, and any important candlestick behaviour. That is a disciplined reading process, not a mechanical system.
Source Note
This article uses public technical-analysis education sources plus TMU’s own older article text and chart annotations, with the body written for clarity rather than citation density.
Investopedia was used for EMA definitions, the way EMA weights recent prices more heavily than SMA, and the warning that EMAs can produce false readings when used alone.
StockCharts ChartSchool was used for the EMA versus SMA distinction, lag factor, and the idea that moving averages help describe trend direction and can act as potential support or resistance references.
Fidelity was used for practical EMA education, especially the explanation that EMA follows current prices more closely than SMA because of its heavier weighting of recent data.
DeMARK Analytics was used for Sequential and 9-13 concepts, including Setup, Countdown, trend exhaustion framing, and the important distinction between reversal risk and reversal certainty.
The older TMU article text and Oz’s chart annotations were used for the original 13 EMA and TD Sequential method. This revamp keeps the useful educational core while removing strategy-style promises and instruction language.
Mini FAQs
Legal And Risk Notice
This article is for educational purposes only and should not be treated as financial, investment, legal, tax or accounting advice. The 13 EMA and TD Sequential can help organise chart reading, but they do not guarantee reversals, continuation, profitable outcomes, or future price direction. Crypto markets are highly volatile, and both moving averages and count-based tools can become noisy, lagging, or misleading in fast conditions. Always treat them as context, not as proof of what must happen next.


Discussion