


HODL Waves show how long Bitcoin has been held before it last moved on-chain. Younger bands expanding usually means turnover is rising, while older bands expanding usually means supply is ageing and spending is muted. Realised HODL Waves add a capital-weighted layer by showing where realised value sits across those age bands. RHODL then compares younger realised cohorts with older realised cohorts to help frame rotation, holder pressure, and cycle context.
What HODL Waves Actually Measure
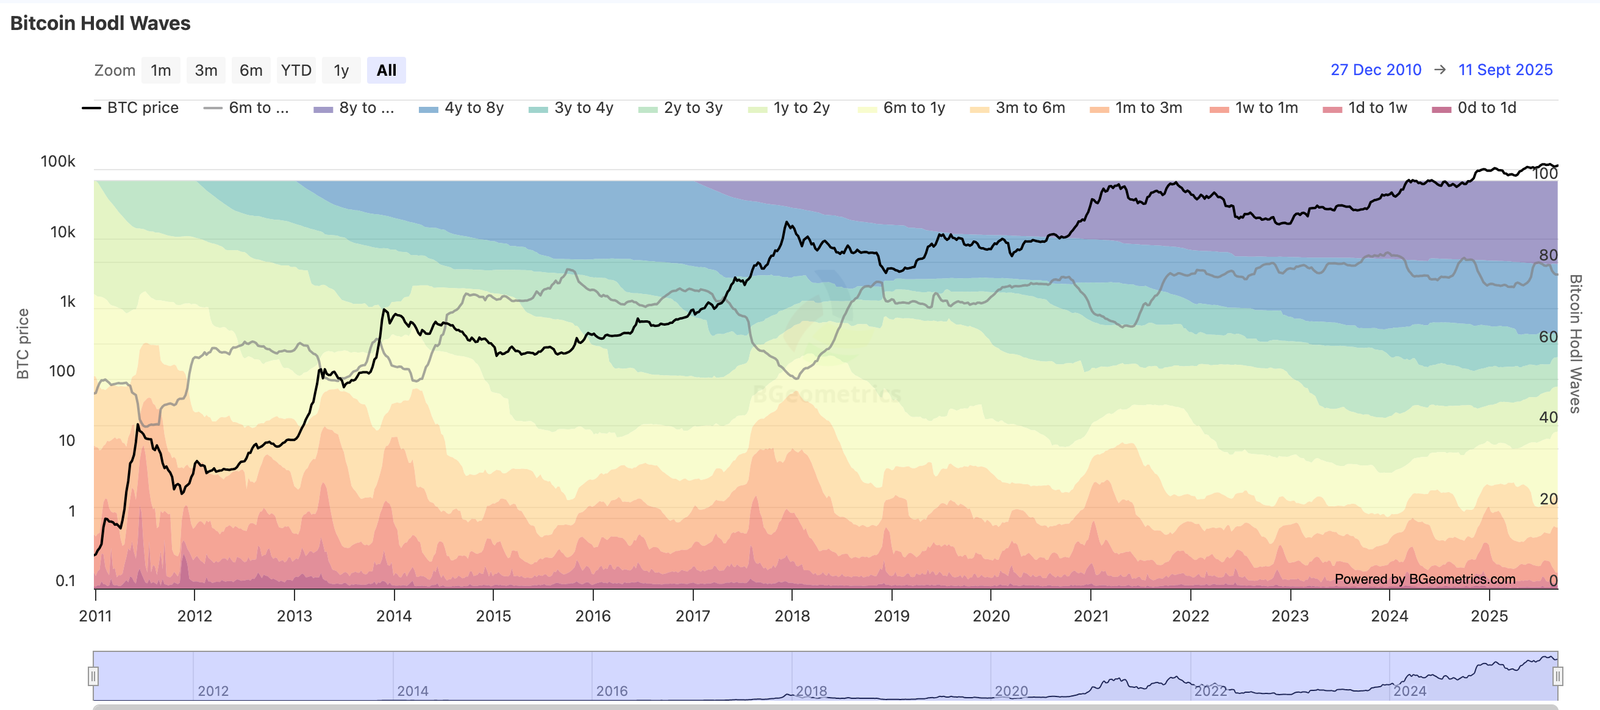
HODL Waves group the Bitcoin supply by coin age. Each band shows how much supply last moved within a specific time window, from very recent movement through to coins that have stayed still for years.
The value of the indicator is behavioural. It helps you see whether the market is dominated by recent movement, older supply, or a gradual rotation between the two.
HODL Waves do not explain why coins moved. They show that coins moved. The interpretation comes from pairing age-band rotation with cost basis, profit and loss, and flow data.
How To Read HODL Waves In Practice
A practical HODL Waves read starts with the balance between younger and older bands. The goal is not to react to every shift, but to decide whether a change is persistent enough to matter.
Younger bands expanding for several weeks can show rising turnover. Older bands expanding for several weeks can show supply ageing. A sudden jump in very young bands may matter less if it fades quickly.
Common mistake: A one-week move in a young age band is not enough by itself. The stronger read is a sustained shift that also appears in realised value, profit and loss behaviour, or flows.
What Realised HODL Waves Add
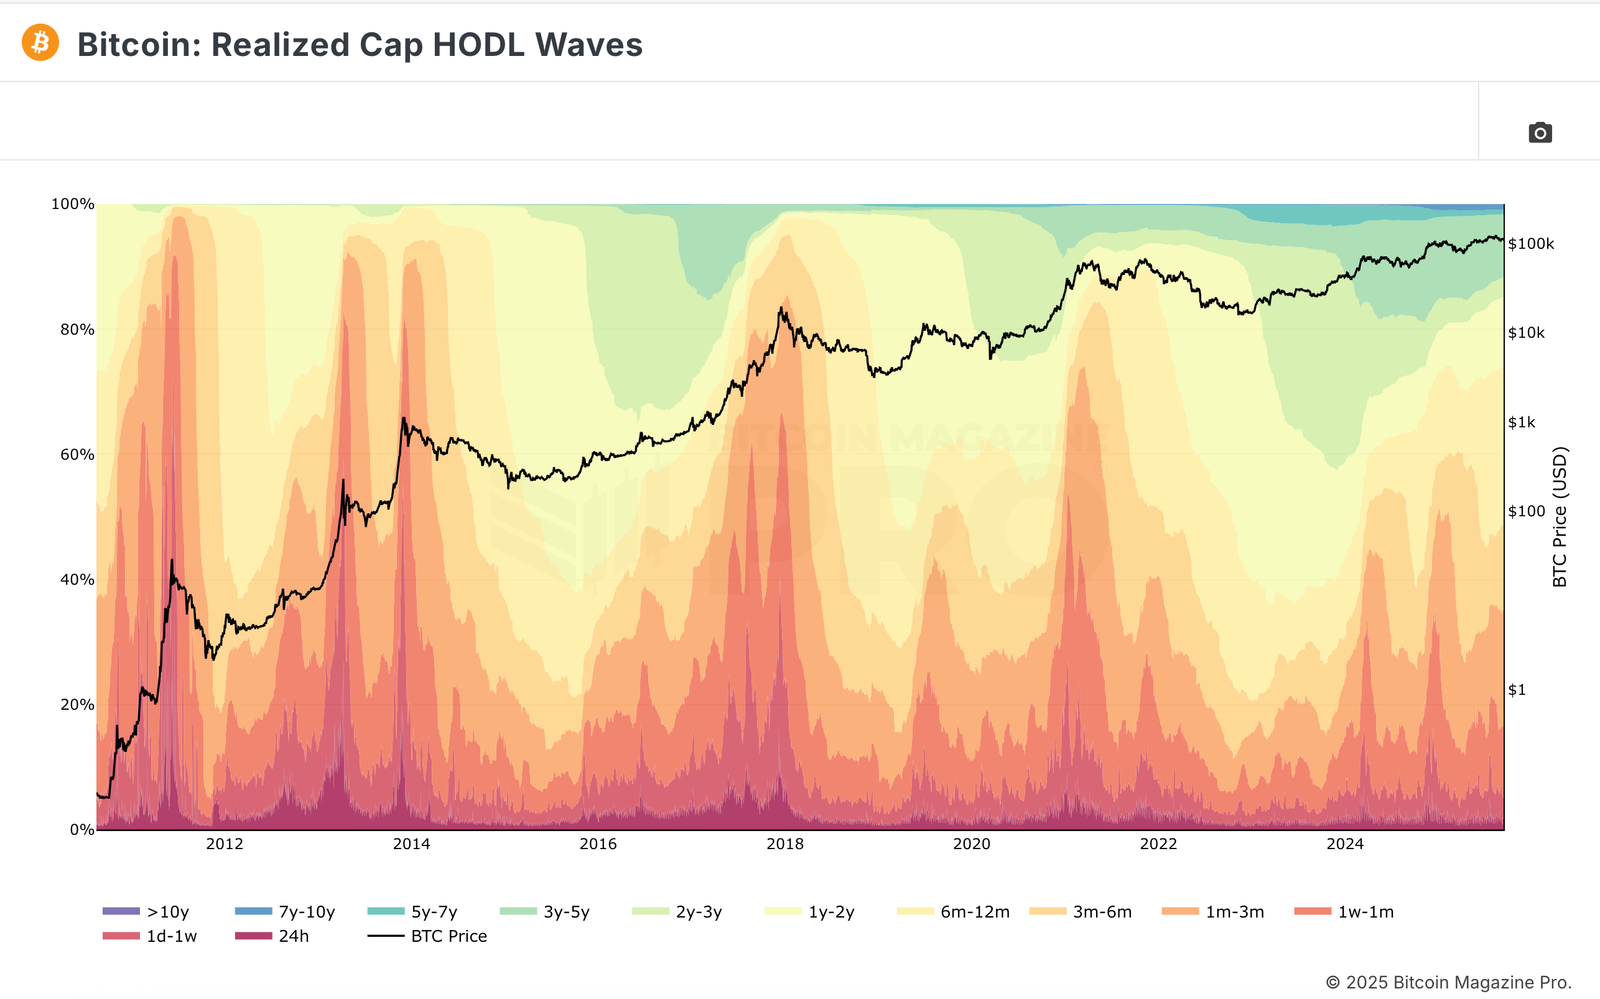
Classic HODL Waves treat each coin the same, regardless of the price at which it last moved. Realised HODL Waves change the lens by weighting each age band by realised value.
That shifts the question from how much supply sits in each age band to how much realised capital sits in each age band. This matters because a smaller amount of supply can carry a larger capital footprint if it last moved at higher prices.
Why it matters: If younger bands rise in realised terms, newer capital may be carrying more weight than the raw coin-share view suggests. If older realised bands remain steady, older capital may still be anchored despite price movement.
A useful method is to compare the classic and realised versions side by side. If both show younger bands expanding, turnover is rising in coin share and realised value. If only the realised version moves sharply, the market may be showing a capital-weighted shift rather than a broad supply shift.
What RHODL Means And When It Helps
RHODL compares younger realised cohorts with older realised cohorts. It is a rotation lens, not a standalone price forecast.
Its job is to show whether capital is moving towards younger cohorts or staying more concentrated in older realised cohorts. That can help frame whether the market is becoming more turnover-driven or still led by older-holder behaviour.
If valuation, profit and loss, and flows also point to late-cycle conditions, stronger younger realised bands can support the idea that turnover pressure is rising.
If recovery indicators are improving while RHODL remains muted, the market may still be in a quieter accumulation or early transition phase.
RHODL is most useful when it confirms what other parts of the on-chain board are already suggesting. It becomes weaker when it is used alone or treated as a mechanical timing tool.
A Simple Weekly Workflow
Weekly checks are enough for most readers. Daily monitoring can make a slow-cycle indicator look more dramatic than it really is.
- Check HODL Waves for broad ageing versus turnover changes.
- Check Realised HODL Waves to see whether capital weight agrees with the supply-share view.
- Compare the read with a cost basis tool such as MVRV, NUPL, or realised price bands.
- Compare the read with a behaviour tool such as SOPR or realised profit and loss.
- Only upgrade the conclusion if multiple indicators point in the same direction.
Common Traps To Avoid
The biggest mistake is treating HODL Waves as a complete timing model. They are better used as a holder-behaviour layer inside a wider on-chain process.
Do not treat old coin movement as automatic distribution. Older coins can move for many reasons. Confirm with realised profit, exchange flows, and cohort data before drawing a stronger conclusion.
- Do not treat one weekly shift as a full regime change.
- Do not assume younger bands rising always means bullish demand. It can also reflect profit-taking or stress.
- Do not ignore cost basis. Age-band movement means more when you know whether the market is spending above or below important cost basis zones.
- Do not use HODL Waves without checking profit and loss behaviour.
Bitcoin Barometer: HODL Waves and RHODL feed the Holder Conviction score inside the Bitcoin Barometer. See where Holder Conviction sits in the current cycle.
Mini FAQs
They show what percentage of Bitcoin supply last moved within each age band. This helps you see whether supply is ageing or turning over more quickly.
HODL Waves measure coin share by age. Realised HODL Waves weight those age bands by realised value, showing where capital is concentrated.
RHODL compares younger realised cohorts with older realised cohorts. It helps frame whether capital is rotating towards newer holders or remaining more anchored in older cohorts.
No. They provide holder-behaviour context. They should be checked beside cost basis, profit and loss, and flow indicators.
A weekly check is usually enough. These indicators are better for regime context than fast day-to-day reactions.
Use cost basis tools such as MVRV, NUPL, or realised price bands, then confirm behaviour with SOPR, realised profit and loss, and flow data.
This content is for education only and does not constitute financial advice. Crypto assets are volatile and you can lose money. Always do your own research and consider your risk tolerance before making any investment decisions.


Discussion