


NUPL measures how much of Bitcoin's circulating supply is sitting in unrealised profit versus unrealised loss, based on the last-moved price of coins on-chain. Higher readings mean more holders are in profit, which can support advances but also raises distribution risk when selling behaviour confirms. Lower readings mean profit is scarce or losses dominate, which often aligns with stress regimes and early recovery conditions.
What Is NUPL?
NUPL stands for Net Unrealised Profit/Loss. It estimates whether the Bitcoin network is sitting in net unrealised profit or net unrealised loss by comparing current market value with the price at which coins last moved on-chain.
Positive NUPL means the network is holding net unrealised profit. Negative NUPL means the network is holding net unrealised loss.
How Is NUPL Calculated?
The concept is built from two parts: unrealised profit and unrealised loss.
- Unrealised profit is the value of coins priced above their last movement price.
- Unrealised loss is the value of coins priced below their last movement price.
- NUPL compares the difference between those two values with market capitalisation.
The result is usually shown as a ratio. A higher value means more of the network is sitting in profit. A lower value means profit is thinner or losses are more widespread.
How To Read NUPL Cycle Zones
NUPL is usually read in zones, not as a precise timing trigger. Different providers use slightly different colour bands, but the general logic is consistent.
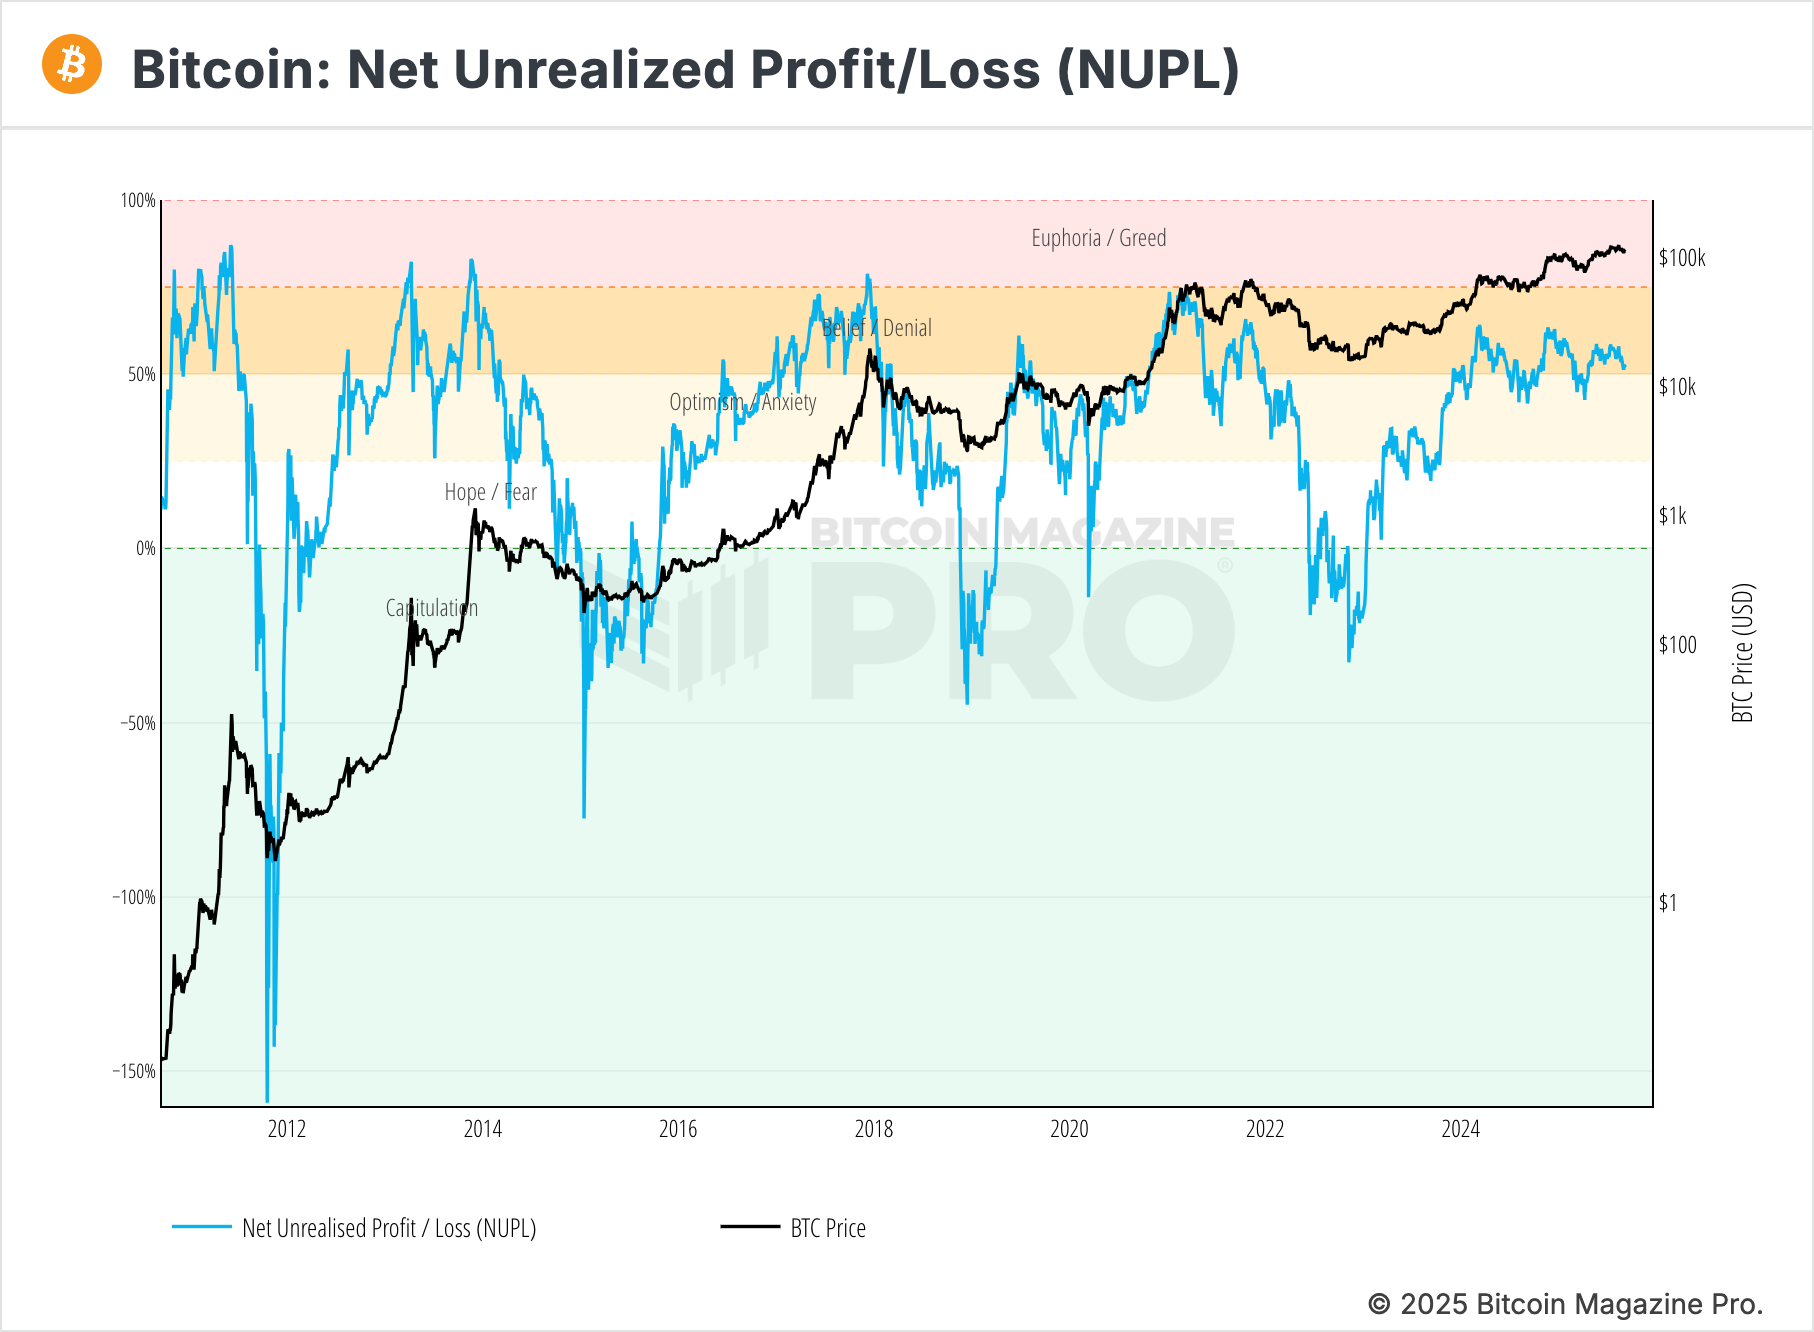
Practical NUPL Reads
The most useful NUPL reads come from zone transitions and persistence. A one-week move into a new zone is less important than a sustained shift that matches other on-chain behaviour.
- Recovery transition: a sustained move from deep stress into the zero to 0.25 range can show losses are easing.
- Participation transition: a sustained move into the 0.25 to 0.5 range often shows broader participation returning.
- Risk transition: a sharp move above 0.5 should be paired with profit-taking tools before assuming it is healthy continuation.
- Warning transition: price making higher highs while NUPL stalls can show thinner participation under the move.
Do not use NUPL as a trigger. It is a regime filter. It helps frame holder comfort and stress, but it does not tell you exactly when price should turn.
Use NUPL With Confluence
NUPL works best when it is paired with cost basis and spending behaviour. It tells you whether profit or loss is widespread. Other tools help you judge whether holders are acting on that position.
Realised Price Bands
Realised Price Bands show whether price is sitting above or below important cost-basis levels. This helps confirm whether a NUPL recovery is supported by stronger cost-basis acceptance.
SOPR And Realised Profit And Loss
SOPR and Realised Profit And Loss help confirm whether holders are taking profit, accepting loss, or absorbing pressure during a NUPL transition.
Dormancy And CDD
Dormancy and Coin Days Destroyed help show whether older coins are participating in the move. That matters because older supply moving can change the meaning of a NUPL shift.
Common NUPL Mistakes
- Treating a single zone as a trade trigger.
- Ignoring timeframe and reacting to short-term fluctuations.
- Assuming high NUPL is automatically bearish.
- Assuming low NUPL is automatically bullish.
- Reading NUPL without checking realised profit, realised loss, and spending-age tools.
A Simple Weekly Workflow
- Open NUPL on a weekly chart and mark the current zone.
- Check whether NUPL is rising, falling, or stalling.
- Compare price with Realised Price Bands to confirm cost-basis context.
- Check SOPR and Realised Profit And Loss to see whether holders are taking profit or accepting stress.
- Review Dormancy or CDD to see whether older supply is participating.
- Decide whether the market is showing recovery, participation, distribution risk, or stress.
NUPL feeds the Valuation score inside the Bitcoin Barometer. See where valuation sits in the current cycle.
See the Bitcoin Barometer →Mini FAQs
This content is for education only and does not constitute financial advice. Crypto assets are volatile and you can lose money. Always do your own research and consider your risk tolerance before making any investment decisions.


Discussion