


RHODL Ratio compares the realised value of younger Bitcoin cohorts with older cohorts. Higher readings suggest newer demand is dominating realised value, which can align with hotter market conditions when distribution and profit-taking also confirm. Lower readings suggest older capital is still dominant or newer demand is muted. Use RHODL as a rotation and regime lens, then confirm with cost basis, spending behaviour and flows.
What Is The RHODL Ratio?
RHODL Ratio compares the realised value held by younger coins with the realised value held by older coins. In practice, it looks at whether more value is concentrated in recently moved coins or in older, more patient cohorts.
When the ratio rises, realised value tilts towards newer hands. When the ratio falls, older hands dominate more of the realised value base.
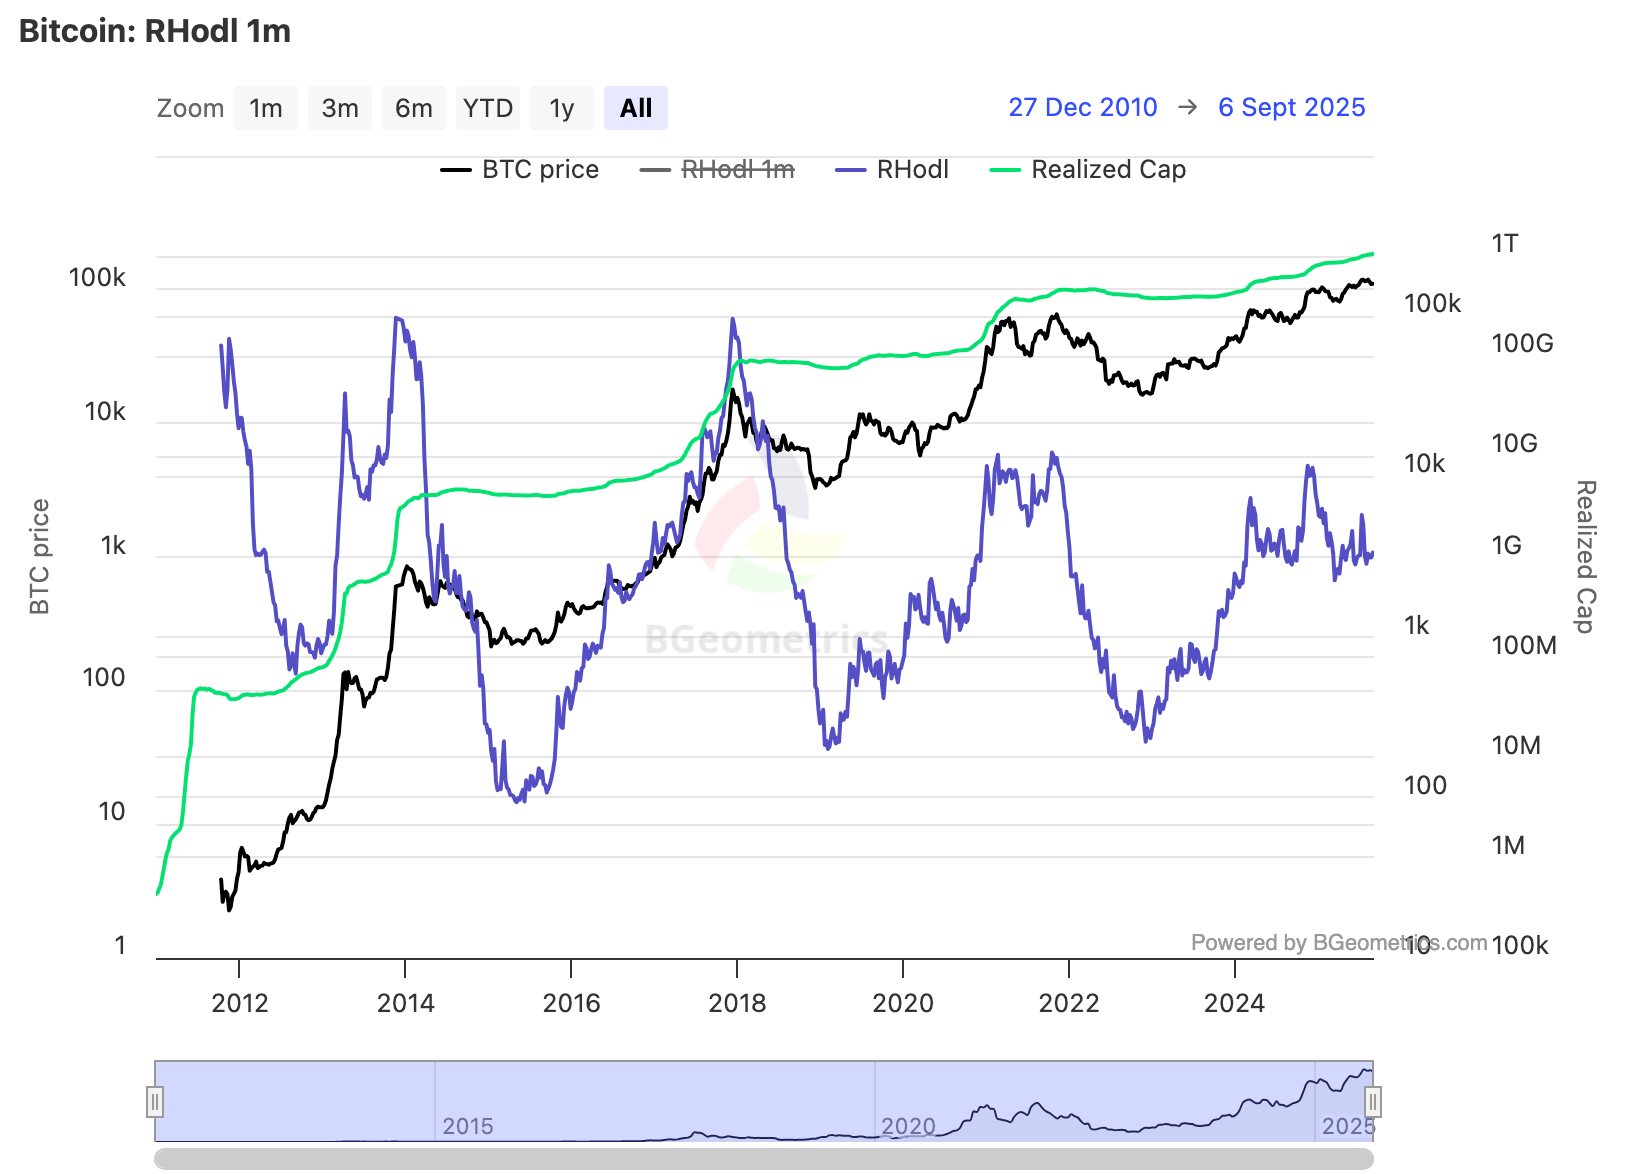
The chart below shows the RHODL Ratio on a monthly view. It helps frame the balance between young and old realised value through different Bitcoin cycle phases.
How Is RHODL Ratio Calculated?
RHODL starts with Realised HODL Waves. It takes the realised value in a younger age band and compares it with the realised value in an older age band.
Different dashboards can apply smoothing, scaling or slightly different age-bucket definitions. That is why the direction, persistence and regime change matter more than treating one fixed number as universal.
Do not overread exact levels. Provider methodology can differ. The cleaner question is whether younger realised value is becoming more dominant, staying elevated, or fading relative to older realised value.
Why RHODL Matters
RHODL matters because it shows when realised value is rotating towards newer cohorts. That can help identify whether a move is being driven by fresh demand, speculative crowding, or a more patient holder base.
High readings often align with phases where recent buyers dominate more of the realised value base. Low or depressed readings often align with periods where older capital remains more important.
The useful question: is new demand expanding in a controlled way, or is realised value concentrating too quickly in younger cohorts while other indicators show distribution pressure?
Interpreting RHODL Zones
Think in zones rather than hard triggers. RHODL is strongest when it helps frame a regime, not when it is treated as a one-line timing tool.
Practical Reads
Inflections matter. A turn up from depressed levels can align with improving participation. A rollover from elevated levels can point to cooling pressure.
Duration matters more than one print. Short spikes can fade. Sustained elevation carries more weight, especially when other indicators confirm the same pressure.
Cohort context matters. Pair RHODL with short-term holder and long-term holder profitability so you can see who is under pressure and whether older supply is actually moving.
Use RHODL With Confluence
Realised Price Bands
Realised Price Bands help show whether rising RHODL is meeting firm cost-basis support or moving into thinner territory. That matters because age-band pressure reads differently when price is above or below major realised-price levels.
SOPR And Realised Profit And Loss
SOPR and Realised PnL Ratio help show whether newer coins are realising profit into the market or whether absorption remains strong enough to handle that pressure.
CDD, Dormancy And Exchange Netflows
Coin Days Destroyed, Dormancy Flow and VDD help show whether older coins are moving. Exchange Netflows help show whether that movement is likely heading towards venues or away from them.
Common trap: RHODL rising does not automatically mean a top is near. High readings can persist in strong advances. Risk rises when RHODL stays elevated and other indicators confirm distribution or weakening absorption.
A Simple Weekly Workflow
- Open RHODL Ratio on a weekly or monthly view and note level, direction and persistence.
- Check Realised Price Bands to understand whether price is above or below major cost-basis levels.
- Use SOPR and Realised PnL Ratio to judge whether profit-taking is being absorbed or rejected.
- Scan CDD, Dormancy and VDD to see whether older coins are moving.
- Check exchange flows to understand whether supply pressure is moving towards venues.
- Form the read only after the behaviour layer confirms or challenges the RHODL signal.
RHODL Ratio feeds the Holder Conviction score inside the Bitcoin Barometer. See where holder conviction sits in the current cycle.
See the Bitcoin Barometer →Mini FAQs
This content is for education only and does not constitute financial advice. Crypto assets are volatile and you can lose money. Always do your own research and consider your risk tolerance before making any investment decisions.


Discussion