


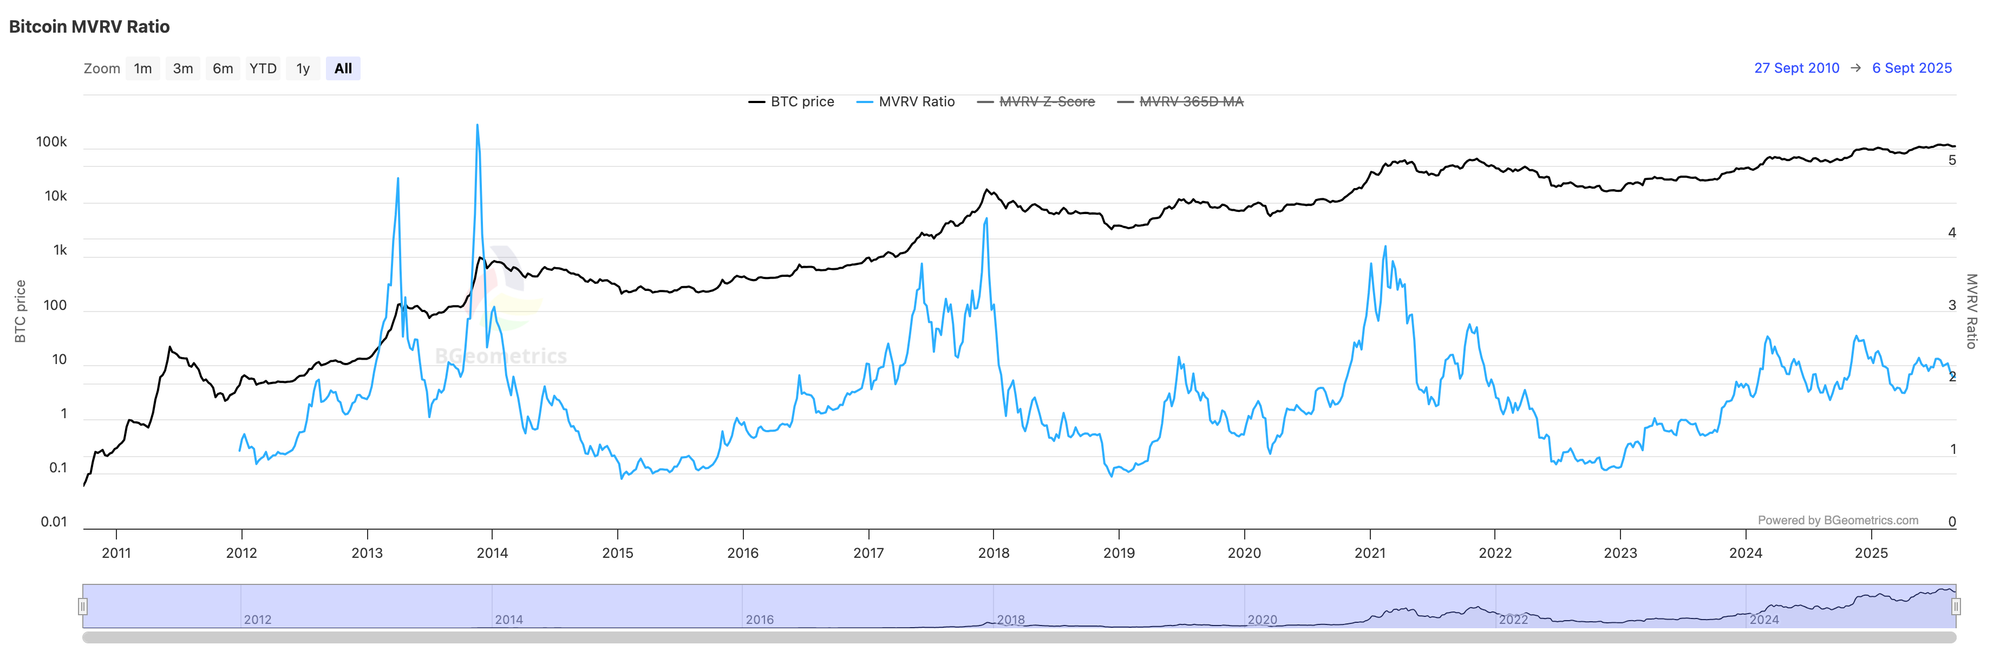
MVRV Ratio measures how expensive Bitcoin is relative to the network's realised cost basis. It divides market cap by realised cap. Values near 1.0 imply price is close to aggregate cost basis. Higher values show a larger premium. Lower values show compression towards what the network paid. Use it as a valuation context layer, then confirm with behaviour indicators before forming a view.
What Is The MVRV Ratio?
The MVRV Ratio compares Bitcoin's market value with its realised value. Market value is price multiplied by circulating supply. Realised value prices each coin at the last time it moved on-chain and then sums that cost basis across the network.
In simple terms, MVRV asks whether Bitcoin is trading far above, near, or below the network's aggregate realised cost basis.
The core idea: when MVRV rises, price is moving ahead of realised cost basis. When it falls, price is converging back towards what holders paid.
How Is MVRV Calculated?
MVRV is calculated by dividing Bitcoin's market cap by its realised cap.
- Market cap: current BTC price multiplied by circulating supply.
- Realised cap: each coin priced at the last time it moved, then summed across the network.
- MVRV Ratio: market cap divided by realised cap.
The result is a valuation ratio. Values near 1.0 imply price is close to the network's average realised cost basis. Higher values imply a growing premium over that base.
Typical Ranges And Risk Bands
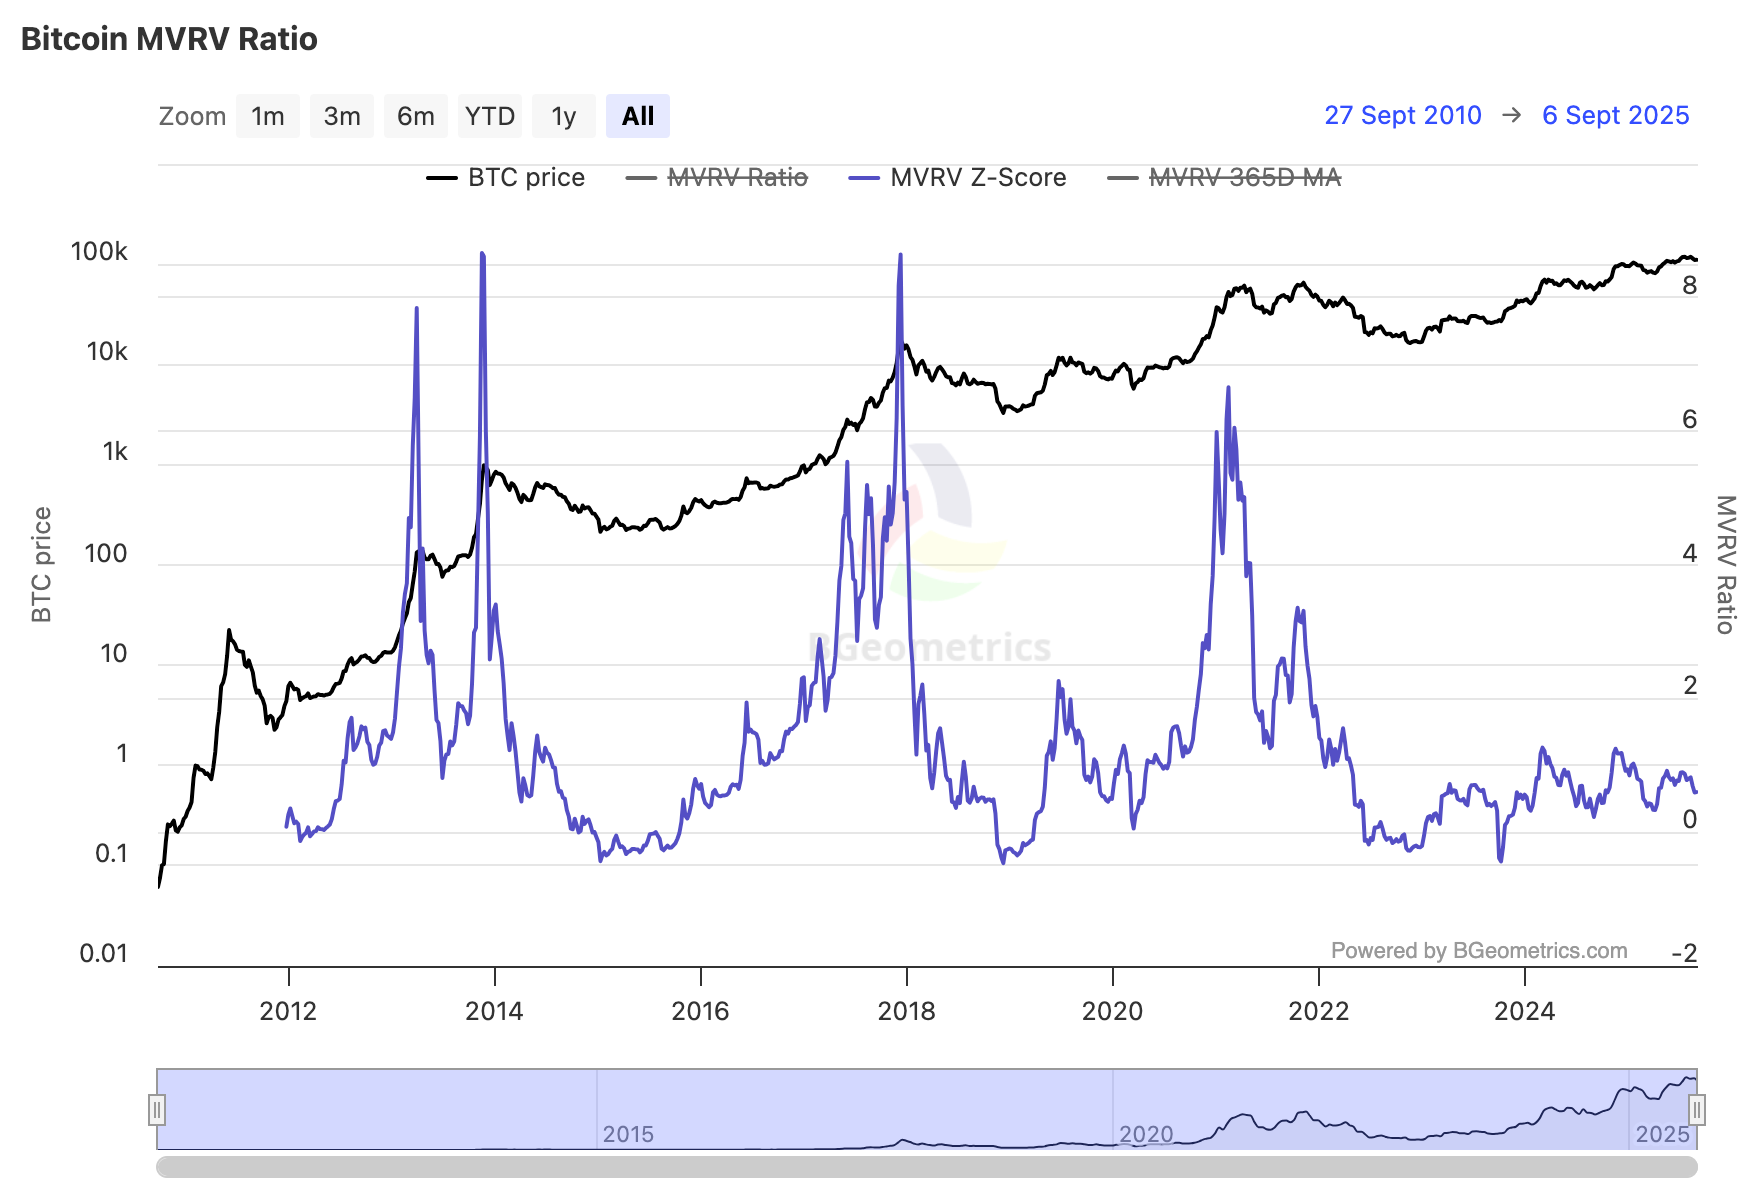
Use these as guides, not triggers. The useful question is whether MVRV is expanding, compressing, or stretched relative to other behavioural evidence.
Do not treat these bands as mechanical triggers. Liquidity, realised cap growth, and participant mix can shift how long a premium persists.
How To Use MVRV In Practice
MVRV works best when it sits inside a wider on-chain read. It gives valuation context. It does not explain holder behaviour by itself.
Build confluence, not single-indicator calls
Combine MVRV with realised price bands, SOPR, Realised PnL Ratio, and spending-age tools such as CDD, Dormancy Flow and VDD. The cleaner read comes from alignment across valuation, behaviour, and supply rotation.
Focus on the trend in premium
A rising MVRV that remains inside mid-cycle zones can accompany healthy advances. A sharp spike into an extreme zone that then reverses deserves more caution.
Watch for divergences
Higher highs in price while MVRV rolls over can point to weakening realised value support. The opposite can flag quiet accumulation beneath price.
Match timeframe to intent
Daily MVRV can move around quickly. For cycle context, weekly or monthly aggregates are usually more useful than reacting to every daily print.
Respect regime shifts
As liquidity and participant mix evolve, historical extremes can migrate. Percentile views can help frame the current reading without relying only on fixed cut-offs.
Common pitfall: MVRV is a valuation layer, not a complete signal. It should be confirmed with holder behaviour, profit and loss, realised price bands, and flows.
A Simple Weekly Workflow You Can Reuse
- Open MVRV on a weekly chart.
- Reference MVRV Z-Score for statistical context.
- Compare the reading with Market, LTH, and STH realised price bands.
- Cross-check SOPR and Realised PnL Ratio to see whether profits are being taken or held.
- Scan CDD, dormancy, or VDD for old-coin movement.
- Decide whether the market shows sustained premium with support, or stretched premium with distribution risk.
MVRV Ratio feeds the Valuation score inside the Bitcoin Barometer. See where valuation sits in the current cycle.
See the Bitcoin Barometer →Mini FAQs
This content is for education only and does not constitute financial advice. Crypto assets are volatile and you can lose money. Always do your own research and consider your risk tolerance before making any investment decisions.


Discussion