


HODLer Net Position Change estimates whether long-term holders are accumulating or distributing over a rolling window. Positive values suggest HODLers are adding to balances. Negative values suggest they are distributing. Treat it as behavioural context, then confirm with exchange flows and profit and loss behaviour to avoid reading it in isolation.
What Is HODLer Net Position Change
This metric tracks whether wallets classed as long-term holders are, on net, increasing their balance or reducing it across a rolling window.
- Positive readings mean HODLer balances are growing.
- Negative readings mean HODLers are distributing.
The clean question it answers is simple: are slow wallets adding, or lightening up.
How It Is Built
Data providers define a HODLer cohort using coin age and spend behaviour. Each day they estimate how the cohort's aggregate balance changes, typically filtering out miner flows, exchange wallets, and short-term churn.
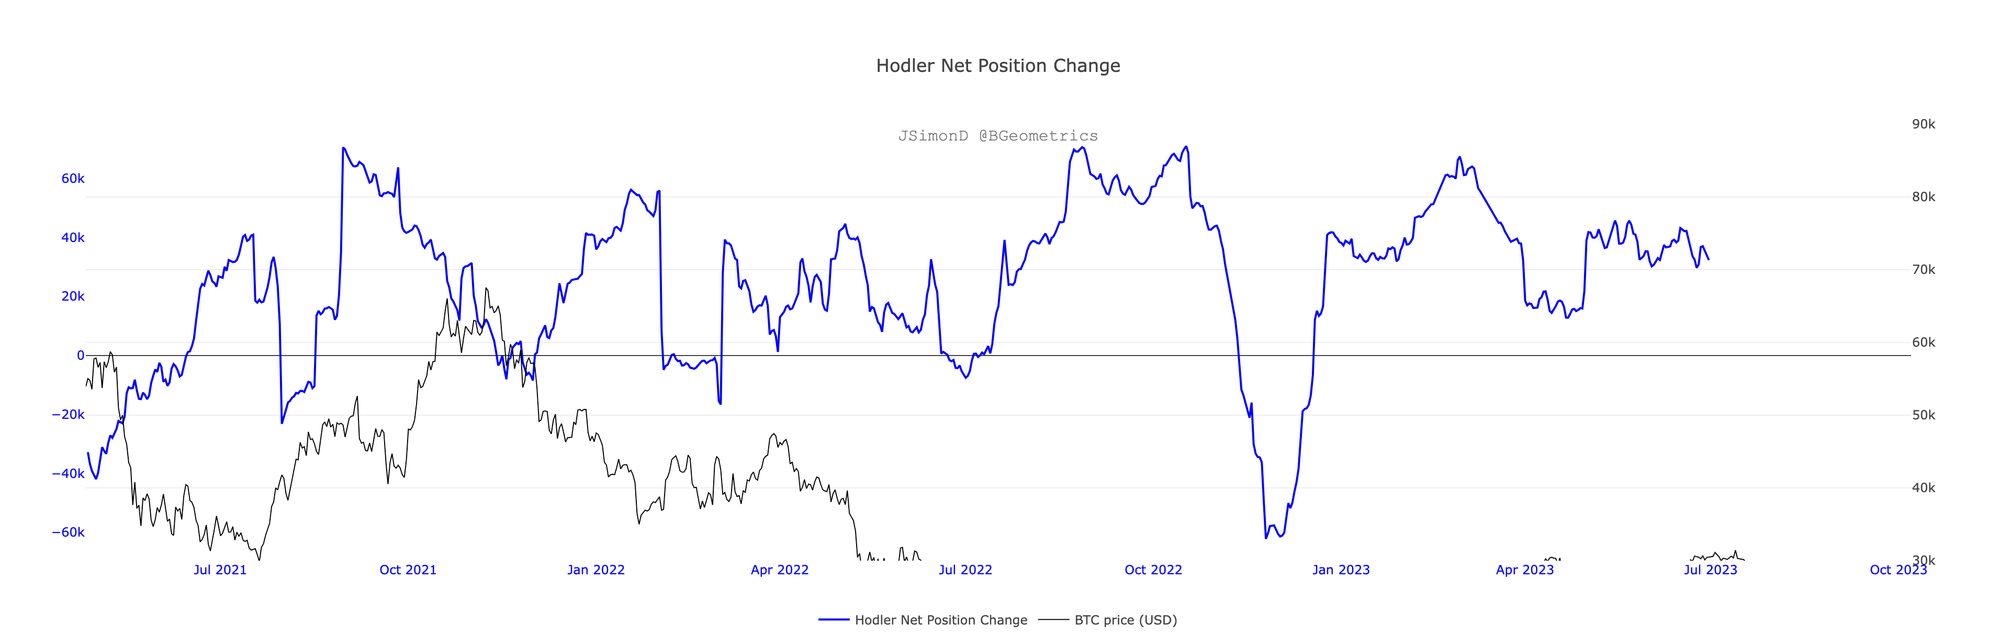
The output is a smoothed series that helps you judge whether long-term entities are accumulating or distributing across the week. The chart below shows the metric in action: bars above zero indicate net accumulation, bars below indicate net distribution. The longer a regime persists on either side, the more meaningful it becomes.
Why It Matters
Long-term wallets influence available float. When they accumulate, less supply tends to sit on venues.
When they distribute into strength, rallies can become exit liquidity rather than continuation moves. The same price level reads differently depending on whether HODLers are adding or selling into it.
During deep drawdowns, a sustained flip back to positive readings can be an early sign that weaker holders have been flushed and longer-term entities are adding again. That shift in posture often precedes improved conditions, though confirmation from other tools is always required before drawing conclusions.
Practical Guide Rails
Use these as guide rails, not rules. Context and confirmation always matter.
Common Traps To Avoid
Not all distribution is bearish. Some supply can move into ETFs or custodian wrappers without hitting spot books. Where the coins end up matters as much as the fact they moved.
Venue flows still matter during accumulation. Net accumulation with heavy exchange inflows can still mean sell pressure exists elsewhere. Always cross-reference with exchange netflows and reserves before forming a view.
Do not over-fit levels. Direction and persistence determine the read. No magic number applies. This metric works as a regime signal, not a precise threshold tool.
Pair It With Other Dials For Confluence
Exchange Netflows
Accumulation plus exchange outflows often means tighter available float. Distribution plus exchange inflows often signals stress and increasing sell-side pressure at venues. The combination of HODLer posture and exchange flow direction gives a more complete read than either dial alone.
Coin Days Destroyed, Volume Days Destroyed, and HODL Waves
These tools confirm which age bands are moving when the HODLer cohort changes stance. If CDD or VDD spikes during a distribution reading, older coins are actively spending, which adds weight to the signal. Stable CDD during a distribution phase can mean the movement is from younger coins being re-tagged rather than genuine long-term holder selling.
Realised PnL Ratio and SOPR
These help confirm whether profit-taking is being absorbed during distribution, or whether selling pressure is overwhelming bids. SOPR readings below one during a distribution phase indicate stress rather than orderly profit-taking at a premium.
Mayer Multiple and the 200-Day Moving Average
These frame stretch and mean reversion context. A HODLer distribution reading near a historically extended Mayer Multiple deserves more caution than one at a compressed reading near the 200-day. Combining posture and valuation context prevents reading the metric in a vacuum.
A Weekly Workflow You Can Reuse
- Mark the weekly average of HODLer Net Position Change as positive, negative, or flat.
- Check exchange netflows and reserves. Are coins heading to venues or leaving them.
- Cross-check SOPR or Realised PnL Ratio and CDD or VDD to judge acceptance and which age bands are spending.
- Act on persistence. Three similar weekly reads build confidence. One bar does not.
- Review on a fixed day each week. A regular cadence reduces headline-driven overreaction and lets the regime speak clearly.
HODLer Net Position Change feeds the Holder Conviction score inside the Bitcoin Barometer. See where holder conviction sits in the current cycle.
See the Bitcoin Barometer →Mini FAQs
This content is for education only and does not constitute financial advice. Crypto assets are volatile and you can lose money. Always do your own research and consider your risk tolerance before making any investment decisions.


Discussion