On-chain and alt-sector research at The Markets Unplugged. Creator of the Bitcoin Barometer, Ethereum Barometer, Alt Sector Radar and ETH Rotation Index.
Host of the Crypto Unplugged podcast.
Realised price bands are Bitcoin cost basis guides built from on-chain data, showing the price at which different cohorts last moved their coins.
Three bands matter: Market realised price covers all coins; LTH realised price covers coins held 155 days or more; STH realised price covers coins held less than 155 days.
Position matters, but slope matters just as much. Rising bands below price signal growing conviction. Flat or falling bands warn the base is weakening even if price holds.
The sequential recovery of the bands is a key regime signal. Spot crossing above Market realised price is a meaningful shift. Crossing above STH realised price confirms newer buyers are profitable again.
Realised price bands are context tools, not standalone signals. SOPR, MVRV, and realised profit and loss confirm what the bands suggest.
Weekly reads are enough for most analytical purposes. Daily checks create noise without improving regime judgement.
Quick Answer
Bitcoin realised price bands map cost basis by cohort. Market realised price is the network-wide average, calculated as Realised Cap divided by circulating supply. LTH and STH realised price split that average into older holders and recent buyers, showing who is under water and who is in profit. The bands are most useful as a regime framework: where price sits relative to the bands, whether the bands are rising or falling, and which cohort is absorbing pressure or distributing. Confirm readings with SOPR or realised profit and loss before drawing conclusions.
Realised price bands are Bitcoin's on-chain cost basis ladders. Instead of showing today's market price, they show the average price at which different groups of coins last moved. That distinction matters: realised price reflects where capital entered the market, not where it is valued today.
Three bands form the core framework:
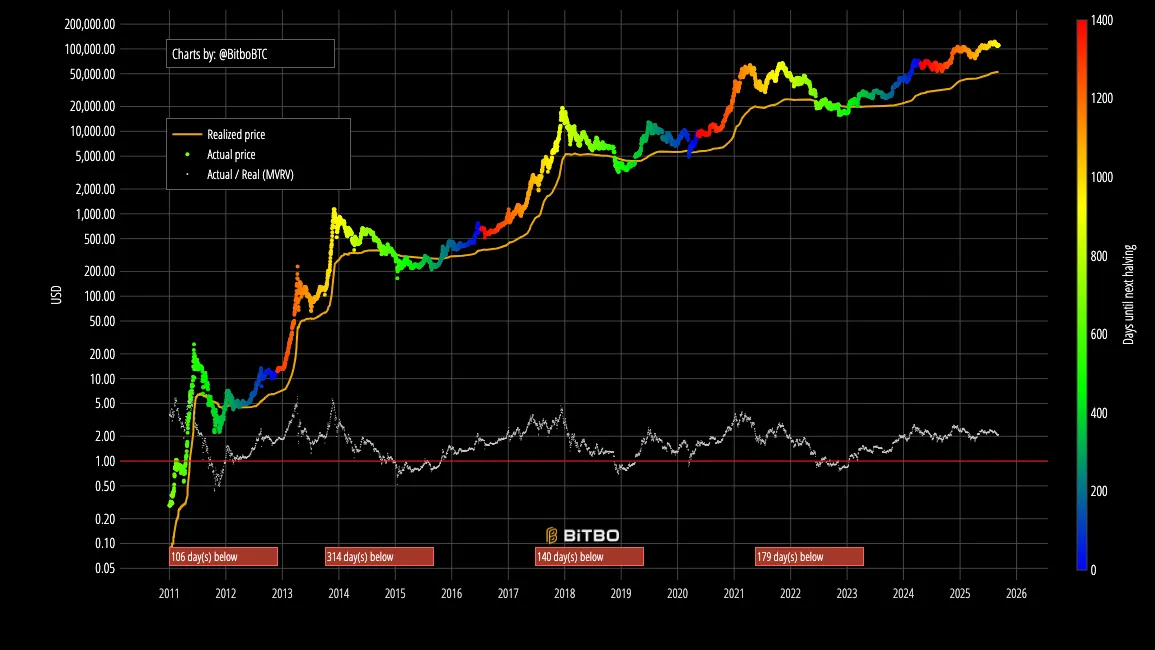
Market Realised Price is the network-wide average cost basis. Every coin on-chain is valued at the last price it moved, then summed and divided by circulating supply. This is Realised Cap divided by supply.
LTH Realised Price applies the same logic only to coins held for 155 days or more. It represents the average cost basis of patient, longer-term holders.
STH Realised Price applies the same logic only to coins held for less than 155 days. It tracks the average cost basis of recent buyers, making it the most sensitive of the three bands to new market activity.
The 155-day threshold separating LTH from STH is a statistical convention used by most on-chain platforms. It reflects the observation that coins held beyond roughly five months are less likely to be sold in short-term volatility.
Bitcoin Realised Price vs Spot: Source Bitbo
How The Three Bands Are Calculated
Each band uses the same underlying method: value every coin at the price it last moved on-chain, then divide by the relevant supply. The difference between them is which coins get included.
Band
Cohort
Formula
What It Reflects
Market Realised Price
All coins in circulation
Realised Cap / Circulating Supply
The network's average cost basis. The most stable of the three bands.
LTH Realised Price
Coins held 155+ days
LTH Realised Cap / LTH Supply
The average cost basis of seasoned holders. Moves slowly. Often well below spot in bull markets.
STH Realised Price
Coins held under 155 days
STH Realised Cap / STH Supply
The average cost basis of recent buyers. Moves quickly with new demand. Most sensitive to price action.
Why MVRV and realised price are connected: MVRV ratio is market cap divided by Realised Cap. When MVRV equals 1.0, spot is exactly at Market Realised Price. Reading realised price bands and MVRV together shows both the absolute level of cost basis and the degree of premium or discount above it.
Reading The Bands As A Regime Framework
The most useful thing realised price bands do is tell you what kind of market you are in, not just where a support level might be. The bands form a regime ladder. Where spot sits on that ladder, and whether the rungs of the ladder are rising or falling, frames the read.
Five phases cover the full cycle:
Phase 1: Bull Extension
Spot well above all three bands. All bands rising.
STH realised price is highest, tracking new buyers' average cost. Market and LTH realised price trail below. The further price stretches above STH realised price, the larger the premium over recent buyer cost basis. MVRV ratios are typically elevated. Rising LTH realised price signals that older holders are gradually resetting their cost basis higher through accumulation at new levels. Watch for distribution signals in SOPR and realised profit and loss.
Phase 2: Healthy Recovery
Spot above STH realised price. All three bands turning up.
All cohorts are average-profitable again. This is the phase where pullbacks into STH realised price tend to find absorption rather than failure. Rising slope across all three bands strengthens the case. SOPR holding above 1.0 on dips is the behaviour confirmation to pair with this.
Phase 3: Correction Zone
Spot between Market realised price and STH realised price.
Recent buyers are under water on average. The market as a whole is still profitable, but the STH cohort is stressed. This zone can be a base-building phase in a healthy cycle or the start of a deeper reset. Watch whether STH realised price is holding as resistance or being reclaimed. STH SOPR flipping to sub-1.0 readings signals capitulation risk.
Phase 4: Bear Stress
Spot below Market realised price. Most holders average under water.
The network as a whole is in loss on average. LTH holders are still above their cost basis, which is why long-term holder behaviour becomes the critical read in this phase. When LTH spending accelerates below Market realised price, it warns the bear may deepen. When LTH spending stays dormant, it suggests conviction from the strongest cohort is intact.
Phase 5: Extreme Capitulation
Spot below LTH realised price. Even long-term holders average under water.
This is historically rare and associated with major cycle lows. Even the most patient cohort is below their average cost basis. When LTH SOPR flattens near 1.0 and spending slows at these levels, it indicates the final capitulation phase may be exhausting. This phase does not stay extended for long and has historically marked the beginning of accumulation by the most conviction-heavy buyers.
The reclaim sequence matters: Spot crossing back above LTH realised price is notable. Crossing back above Market realised price is a regime shift. Crossing back above STH realised price is confirmation that the recovery is broad-based. Watch the sequence, not just the individual levels.
Practical Reads: Above Cost Basis vs Below
The most common analytical question is whether a given price level represents absorption or rejection. The bands frame that question. The behaviour tools answer it.
Constructive Signals
Spot holds above STH realised price after a dip
STH realised price is rising alongside price
LTH realised price trending up during sideways chop
Market realised price acting as support during corrections
Distance between STH and LTH realised price narrowing in recovery
SOPR holding above 1.0 at STH realised price touches
Stress Signals
STH realised price acting as resistance after a failed reclaim
Market realised price lost and not recovered within days
All three bands flattening or declining while spot is sideways
Price stretching far above all bands without consolidation
SOPR declining below 1.0 at band tests with no recovery
The slope trap: It is possible for spot to sit above all three bands while those bands are flat or declining. That configuration looks superficially bullish but lacks the accumulation signal that comes with rising bands. Position without slope is a weaker read. Always check both.
Use With Confluence
Realised price bands answer "where is cost basis?" Behaviour tools answer "what are holders doing at that level?" The two together produce a complete read. Valuation tools add a third layer: "how stretched is the premium above cost basis?"
Rising 1Y+ age bands alongside rising LTH realised price signal accumulation by conviction holders. Supply moving younger at LTH realised price warns of distribution.
Overlay realised profit and loss spikes against band levels to see whether profit-taking is concentrated at specific cost basis thresholds.
Common Pitfalls
Treating bands as hard support or resistance. Realised price bands are dynamic averages. They shift constantly as coins move. A band that held as support last month may be in a different position now. Use them for regime context, not for precise level trading.
Reading any single band in isolation. A brief dip below STH realised price that immediately recovers reads differently from a sustained period below it. The persistence of the move, and what SOPR is doing during it, carries as much analytical weight as the level itself.
Assuming extreme phases resolve quickly. Phase 5 (spot below LTH realised price) is historically brief but can persist for months. Seeing price below LTH realised price is not an automatic buy signal. Wait for behaviour confirmation: declining LTH spending, SOPR stabilising near 1.0, and exchange netflows turning negative.
A Six-Step Weekly Workflow
Run this on a weekly chart. Daily checks add noise without improving the regime read.
Open a weekly chart with Market, LTH, and STH Realised Price overlaid. Note which phase framework applies based on where spot sits relative to the three bands.
Check the slope of each band. Are they rising, flat, or declining? Rising bands across all three are a structural positive regardless of short-term price noise.
Identify which band is closest to current spot. This determines the most relevant behaviour tool to watch this week.
Pull aSOPR. Is it above or below 1.0? Is it trending toward or away from that level? This confirms whether recent movers are in profit or loss at current prices.
Cross-check MVRV to gauge how stretched the premium is above Market Realised Price. A rising premium with no corresponding rise in realised profit and loss spending is constructive. The same premium with heavy distribution is a warning.
Set your regime conclusion. Bull extension, healthy recovery, correction zone, bear stress, or extreme capitulation. Each implies a different analytical priority for the week ahead.
Weekly on-chain analysis live now
Alpha Insider members get a weekly on-chain read that applies this framework to current cycle conditions, alongside KAIROS timing windows and DCA target levels mapped for this cycle.
It is the network's average cost basis. Instead of using today's market price, it values each coin at the last price it moved on-chain. That means it reflects where capital entered the market, not where the market currently prices it.
Market price is today's quote. Realised price reflects the average cost basis of the network based on when coins actually moved. In extreme bull markets, market price sits well above realised price. In deep bears, they converge or market price dips below realised price.
LTH realised price shows the average cost basis of coins held 155 days or more. STH realised price shows the average cost basis of coins held less than 155 days. Together they tell you which cohort is under pressure and which is sitting in profit at any given price level.
No. They are regime and context tools. Whether a band holds as support or gives way as resistance depends on what holder behaviour looks like at that level, not on the band itself. Always pair with SOPR or realised profit and loss before drawing a conclusion.
Use SOPR or realised profit and loss for spending behaviour, MVRV or NUPL for valuation context, and HODL Waves or exchange netflows for supply movement signals. No single tool is sufficient; the bands frame the question and the behaviour tools answer it.
Weekly is the right cadence for most analytical purposes. The bands move slowly because they reflect average cost basis across large cohorts. Daily checks often show noise rather than signal, and risk distorting the regime read with short-term moves.
This guide covers the educational framework. Applying it to live cycle conditions, with KAIROS timing and mapped DCA levels, is what Alpha Insider membership provides each week.
This content is for education only and does not constitute financial advice. Crypto assets are volatile and you can lose money. Always do your own research and consider your risk tolerance before making any investment decisions.
On-chain and alt-sector research at The Markets Unplugged. Creator of the Bitcoin Barometer, Ethereum Barometer, Alt Sector Radar and ETH Rotation Index.
Host of the Crypto Unplugged podcast.
Co-founder and lead technical analyst at The Markets Unplugged. Leads technical,
macro, and cycle analysis, and builds the timing and macro frameworks behind TMU's
premium research. Instructor on the Cycle Intelligence course.
Co-founder and lead technical analyst at The Markets Unplugged. Leads technical,
macro, and cycle analysis, and builds the timing and macro frameworks behind TMU's
premium research. Instructor on the Cycle Intelligence course.
Co-founder and lead technical analyst at The Markets Unplugged. Leads technical,
macro, and cycle analysis, and builds the timing and macro frameworks behind TMU's
premium research. Instructor on the Cycle Intelligence course.
Co-founder and lead technical analyst at The Markets Unplugged. Leads technical,
macro, and cycle analysis, and builds the timing and macro frameworks behind TMU's
premium research. Instructor on the Cycle Intelligence course.
Co-founder and lead technical analyst at The Markets Unplugged. Leads technical,
macro, and cycle analysis, and builds the timing and macro frameworks behind TMU's
premium research. Instructor on the Cycle Intelligence course.
Co-founder and lead technical analyst at The Markets Unplugged. Leads technical,
macro, and cycle analysis, and builds the timing and macro frameworks behind TMU's
premium research. Instructor on the Cycle Intelligence course.
Co-founder and lead technical analyst at The Markets Unplugged. Leads technical,
macro, and cycle analysis, and builds the timing and macro frameworks behind TMU's
premium research. Instructor on the Cycle Intelligence course.
Co-founder and lead technical analyst at The Markets Unplugged. Leads technical,
macro, and cycle analysis, and builds the timing and macro frameworks behind TMU's
premium research. Instructor on the Cycle Intelligence course.
Co-founder and lead technical analyst at The Markets Unplugged. Leads technical,
macro, and cycle analysis, and builds the timing and macro frameworks behind TMU's
premium research. Instructor on the Cycle Intelligence course.
Co-founder and lead technical analyst at The Markets Unplugged. Leads technical,
macro, and cycle analysis, and builds the timing and macro frameworks behind TMU's
premium research. Instructor on the Cycle Intelligence course.
Co-founder and lead technical analyst at The Markets Unplugged. Leads technical,
macro, and cycle analysis, and builds the timing and macro frameworks behind TMU's
premium research. Instructor on the Cycle Intelligence course.
Co-founder and lead technical analyst at The Markets Unplugged. Leads technical,
macro, and cycle analysis, and builds the timing and macro frameworks behind TMU's
premium research. Instructor on the Cycle Intelligence course.
Co-founder and lead technical analyst at The Markets Unplugged. Leads technical,
macro, and cycle analysis, and builds the timing and macro frameworks behind TMU's
premium research. Instructor on the Cycle Intelligence course.
Co-founder and lead technical analyst at The Markets Unplugged. Leads technical,
macro, and cycle analysis, and builds the timing and macro frameworks behind TMU's
premium research. Instructor on the Cycle Intelligence course.
Co-founder and lead technical analyst at The Markets Unplugged. Leads technical,
macro, and cycle analysis, and builds the timing and macro frameworks behind TMU's
premium research. Instructor on the Cycle Intelligence course.
Co-founder and lead technical analyst at The Markets Unplugged. Leads technical,
macro, and cycle analysis, and builds the timing and macro frameworks behind TMU's
premium research. Instructor on the Cycle Intelligence course.
Co-founder and lead technical analyst at The Markets Unplugged. Leads technical,
macro, and cycle analysis, and builds the timing and macro frameworks behind TMU's
premium research. Instructor on the Cycle Intelligence course.
Co-founder and lead technical analyst at The Markets Unplugged. Leads technical,
macro, and cycle analysis, and builds the timing and macro frameworks behind TMU's
premium research. Instructor on the Cycle Intelligence course.
Co-founder and lead technical analyst at The Markets Unplugged. Leads technical,
macro, and cycle analysis, and builds the timing and macro frameworks behind TMU's
premium research. Instructor on the Cycle Intelligence course.
Co-founder and lead technical analyst at The Markets Unplugged. Leads technical,
macro, and cycle analysis, and builds the timing and macro frameworks behind TMU's
premium research. Instructor on the Cycle Intelligence course.





Discussion