


The live concordance tool is available here: Jan Range Concordance.
This article connects to the January range monthly close analysis here and the BTC/VIX framework here.
The Problem With Single-Signal Analysis
Every cycle produces the same debate. Bulls point to on-chain accumulation and call for new highs. Bears point to macro headwinds and call for new lows. Both sides pick the signals that support their conclusion and either ignore or dismiss what does not fit.
The more useful question is what the full picture looks like when you read multiple independent frameworks simultaneously and take all of them seriously, including the uncomfortable ones.
The TMU Macro Concordance was built to address exactly that problem. It does not tell you what Bitcoin will do. It tells you which historical years had a macro environment most similar to today and what Bitcoin did in those years. The rest is context, not conclusion.
What the Concordance Does
The tool takes January's price action across seven macro assets and uses those ranges as a directional reference for the entire year.
Every January each asset prints a high and a low. That range becomes the structural reference. From February onwards, the first monthly close above the January high is a Bull break. The first monthly close below the January low is a Bear break. If neither level is broken by December the asset is Neutral.
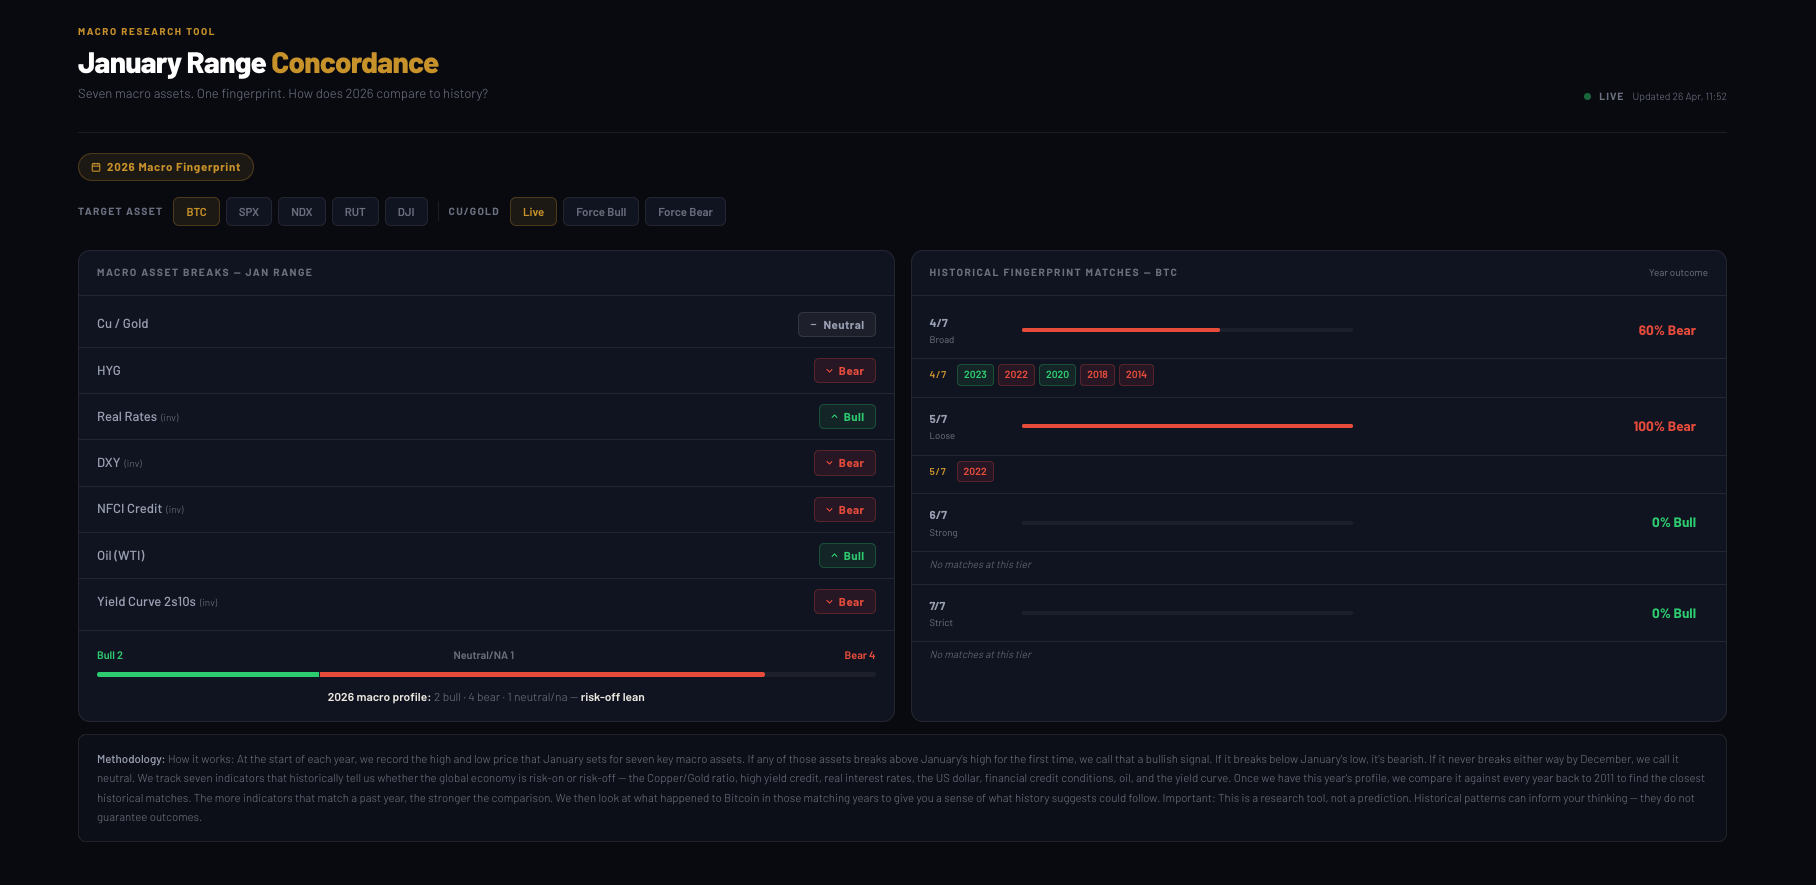
This is applied across seven assets simultaneously. The combination of Bull, Bear, and Neutral labels forms the year's macro fingerprint. That fingerprint is then scored against every historical year back to 2011. Results are shown in four confidence tiers: 4/7 Broad, 5/7 Loose, 6/7 Strong, and 7/7 Strict.
Each tier shows the matching years coloured green for Bull and red for Bear, with the percentage of Bull versus Bear historical outcomes for Bitcoin.
The Seven Assets and What They Measure
Each asset carries independent information about the macro environment. Together they cover the full picture of global risk appetite, credit conditions, liquidity, and growth expectations.
Copper to Gold ratio Measures risk appetite and growth expectations. Copper rises when economic growth is expected. Gold rises when uncertainty is elevated. The ratio between them is one of the most reliable real-time reads on whether markets are leaning into risk or retreating from it. This is also the currently unresolved signal in the 2026 fingerprint, and its resolution matters more than any other single input in the current reading.
HYG — High yield credit Tracks the price of below-investment-grade corporate bonds. When HYG falls, the spread between high yield and safe assets widens, signalling financial stress and reduced risk appetite. High yield credit is one of the most sensitive leading indicators of tightening or easing credit conditions.
Real Rates — inverted Real interest rates adjusted for inflation. Rising real rates increase the cost of capital and create headwinds for risk assets. The concordance inverts this signal so that falling real rates register as Bull and rising real rates register as Bear.
DXY — US Dollar Index — inverted A stronger dollar tightens global liquidity. The concordance inverts DXY so that a weaker dollar, historically bullish for Bitcoin and risk assets, registers as Bull. A stronger dollar registers as Bear.
NFCI Credit conditions The National Financial Conditions Index measures the overall tightness or ease of financial conditions across money markets, debt markets, and equity markets. Easing financial conditions are bullish for risk assets. Tightening conditions are bearish.
Oil (WTI) — growth and demand proxy Oil prices reflect real economy demand and growth expectations in a non-shock context. A Bull break in oil signals expanding economic activity and risk appetite.
Yield Curve 2s10s The spread between 10-year and 2-year Treasury yields. A steepening curve signals improving growth expectations and expanding liquidity. An inverted or flat curve signals stress. Steepening is bullish. Inversion is bearish.
The 2026 Macro Fingerprint
The current 2026 fingerprint across all seven assets:
- Cu/Gold: Unresolved
- HYG: Bear
- Real Rates: Bull
- DXY: Bear
- NFCI Credit: Bear
- Oil (WTI): Bull
- Yield Curve 2s10s: Bear
The confirmed summary: 2 Bull signals confirmed, 4 Bear signals confirmed, with Cu/Gold still unresolved. The overall lean is risk-off.
The Unresolved Signal: Why Cu/Gold Is the Most Important Variable to Watch
Copper/Gold has not yet broken either way from its January range. It has not closed a monthly candle above the January high or below the January low. It is sitting in no man's land with the year still in progress.
This matters more than it might appear on the surface.
Cu/Gold is the swing factor in the 2026 concordance. Its resolution changes the historical analog set significantly. The direction it breaks determines which historical years match the current fingerprint at the 4/7 Broad tier, which years fall away, and what the balance of Bull versus Bear Bitcoin outcomes looks like across the matching set.
The two scenarios produce meaningfully different historical pictures. One is notably more constructive for Bitcoin than the other. Which one applies depends entirely on where Copper/Gold closes relative to its January range on a monthly basis before the end of the year.
This is not something we can resolve in a public article. The full scenario breakdown, showing exactly which years match under each Cu/Gold assumption and what the Bitcoin outcome percentages are in both cases, is available to Alpha Insider members through the TradingView indicator with the Cu/Gold override function.
What we can say publicly is that Cu/Gold resolving to the upside produces a more constructive historical analog picture than Cu/Gold resolving to the downside. The magnitude of that difference is the members-only part.
Watch the monthly closes on the Copper/Gold ratio. It is the single most important unresolved variable in the current macro concordance reading.
Being Honest About the 5/7 Analog
At the 5/7 Loose tier, regardless of how Cu/Gold resolves, the historical matching set produces an uncomfortable reading. The closest analog at that tier is 2022. Bitcoin fell approximately 65 percent that year. It was the worst year in Bitcoin's recorded history.
Dismissing this signal because it is inconvenient would be exactly the kind of selective analysis that makes most market commentary useless. So let us take it seriously.
What made 2022 specifically catastrophic for Bitcoin was not just the macro fingerprint. The macro environment was hostile, but what turned a bearish macro year into a historic collapse was a cascade of internal market failures that compounded those headwinds in a way the macro fingerprint alone cannot capture.
LUNA wiped out approximately $40 billion in May 2022. Three Arrows Capital failed in June. Celsius, Voyager, and BlockFi froze withdrawals. FTX collapsed in November. Each event triggered forced selling across the entire market. Long-term holders capitulated. MVRV fell and stayed below 1 for an extended period. The on-chain data showed genuine sustained capitulation not temporary fear.
The 2026 macro fingerprint at the 5/7 tier resembles 2022. That is real and worth respecting.
The internal conditions are not the same. There has been no structural collapse of a major ecosystem in 2026. Long-term holders have been accumulating through the drawdown. MVRV approached 1 briefly and has recovered. Exchange outflows have been elevated, meaning coins are moving to cold storage rather than to exchanges for selling. The BTC/VIX trendline held at the February low. The volume profile HVN 85% at $64,000 held on monthly closes despite a wick to $60,000 in April.
The macro fingerprint resembles 2022. The internal crypto conditions do not. Both things can be true simultaneously and reading both honestly is more useful than cherry-picking either one.
How to Use This Tool Correctly
Use it to calibrate risk, not to make binary calls. A macro fingerprint that skews toward Bear analog years is a reason to be thoughtful about position sizing. It is not necessarily a reason to exit or go short.
Read it alongside internal crypto signals. The concordance measures the macro environment. It does not measure what holders are doing on-chain, where leverage sits, or whether stablecoins are being deployed or withdrawn. The BCI and CCI frameworks in the weekly Market Pulse add the other half of the picture.
Watch how Cu/Gold resolves. The monthly close of the Copper/Gold ratio is the single most important variable in the current concordance reading. The direction of that resolution changes the historical analog set in a way that matters for how you weight the overall macro picture.
Respect the disclaimer. Historical patterns inform thinking. They do not guarantee outcomes. The same macro fingerprint can produce different outcomes depending on internal conditions, external shocks, and policy responses that the fingerprint cannot capture.
What the Full Tool Gives Members
The free version of the concordance tool shows the current live 2026 fingerprint with all four matching tiers and the historical Bitcoin outcomes. That is a genuinely useful research tool and it is available to everyone.
What members get through the full TradingView indicator goes further in three specific ways.
Cu/Gold scenario modelling. Because Copper/Gold is currently unresolved, members can force it to Bull or Bear and see exactly how the analog set changes under each assumption. The full breakdown of which years match, what the Bitcoin outcome percentages are, and how significantly the picture shifts between the two scenarios is only available through this function. Given that Cu/Gold is the swing factor in the current reading, this is where the most significant analytical edge sits.
Target asset switching. Members can switch between Bitcoin, SPX, NDX, RUT, and DJI to see how the same macro fingerprint has historically played out across multiple markets simultaneously. Understanding the multi-asset context gives richer positioning perspective across a broader portfolio.
Real-time Pine Script updates. The TradingView indicator updates live as monthly closes change throughout the year. Members see the fingerprint evolve in real time as new data arrives,
The free tool gives you the current verdict. The member tool lets you stress-test it under the assumptions that matter most right now.
Explore the live concordance here. Full member access here.
Frequently Asked Questions
What is the TMU Macro Concordance? A research tool comparing 2026's macro fingerprint across seven assets against every year since 2011 to find historical analogs and show what Bitcoin did in those matching years.
What is a macro fingerprint? A seven-signal snapshot showing whether each macro asset broke above its January high (Bull), below its January low (Bear), or neither (Neutral) during the year.
What seven assets does it track? Copper/Gold ratio, HYG high yield credit, Real Rates inverted, DXY inverted, NFCI Credit conditions, Oil WTI, and Yield Curve 2s10s.
What is the current 2026 reading? 2 Bull confirmed, 4 Bear confirmed, Cu/Gold unresolved. The direction Cu/Gold resolves significantly changes the historical analog picture at the 4/7 tier. The 5/7 tier shows an uncomfortable reading regardless of Cu/Gold's direction.
Why is Cu/Gold so important right now? It is the unresolved swing signal whose direction changes the historical analog set and Bitcoin outcome percentages at the 4/7 tier significantly. The full scenario breakdown under both assumptions is available to members through the TradingView indicator's Cu/Gold override function.
Does the 5/7 analog mean Bitcoin will crash? Not necessarily. The closest 5/7 match is 2022 but 2022's severity came from a cascade of internal crypto failures that compounded the macro headwinds. Those structural failures are not present in 2026. The concordance is one lens. Internal on-chain conditions add the other half of the picture.
What can members model that free users cannot? The full Cu/Gold scenario breakdown showing exactly how the analog set and Bitcoin outcome percentages change under Bull and Bear assumptions. Target asset switching across BTC, SPX, NDX, RUT, and DJI. Real-time Pine Script updates through the full TradingView indicator.
How does the matching system work? Each historical year is scored against the current fingerprint. A match is counted when both years share the same signal on a given asset. Results are shown at four confidence tiers: 4/7 Broad, 5/7 Loose, 6/7 Strong, and 7/7 Strict.
The live concordance tool is available at Jan Range Concordance. Full member access including Cu/Gold scenario modelling and the TradingView indicator is available at The Markets Unplugged membership.


Discussion