


The Tape opens to Alpha Insider members on 29 October. This week we added three things you will use on the chart, tested each one against four years of history, and cut the flashes back to the ones worth your attention.
1. Weekly buy zones, and the gold box
On the weekly chart, a green zone marks where buyers stacked their orders, just under that week's close. Each zone counts for the four weeks after it forms.
What matters is how price gets there. When price reaches the zone on a calm day and buyers step in the next day, The Tape outlines that day in gold.
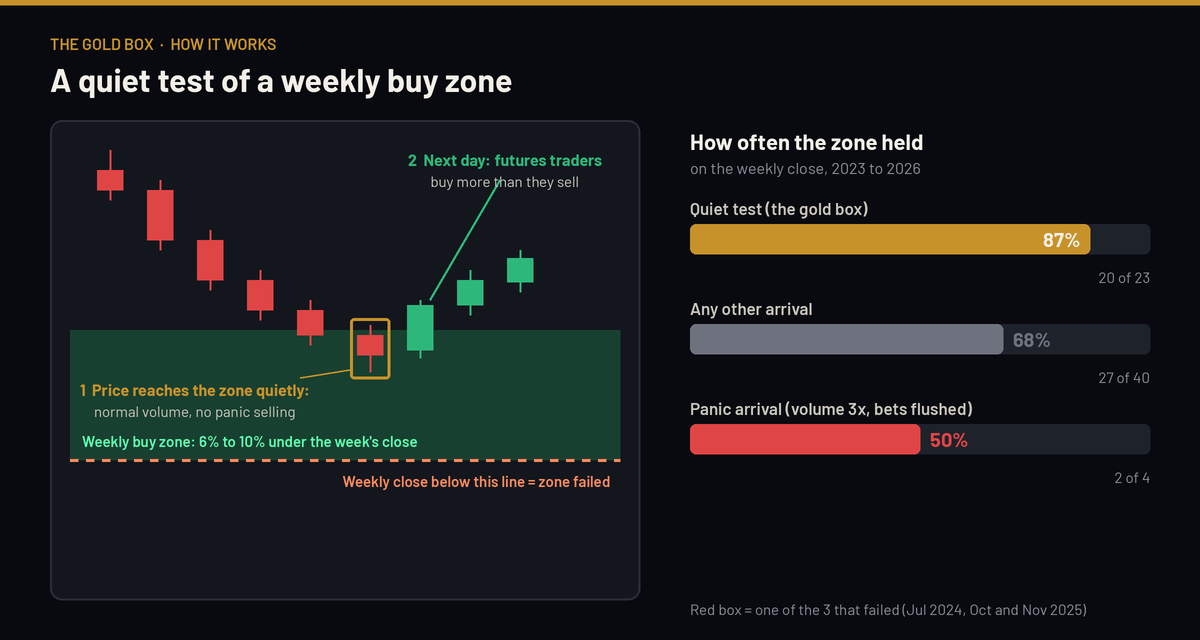
After a gold box, the zone held on the weekly close 87% of the time since 2023 (20 times out of 23). When price arrived any other way it held 68% of the time, and after a panic only half the time.
The three that failed are outlined in red: July 2024, and late October and early November 2025, right after last year's cycle top.
What to watch
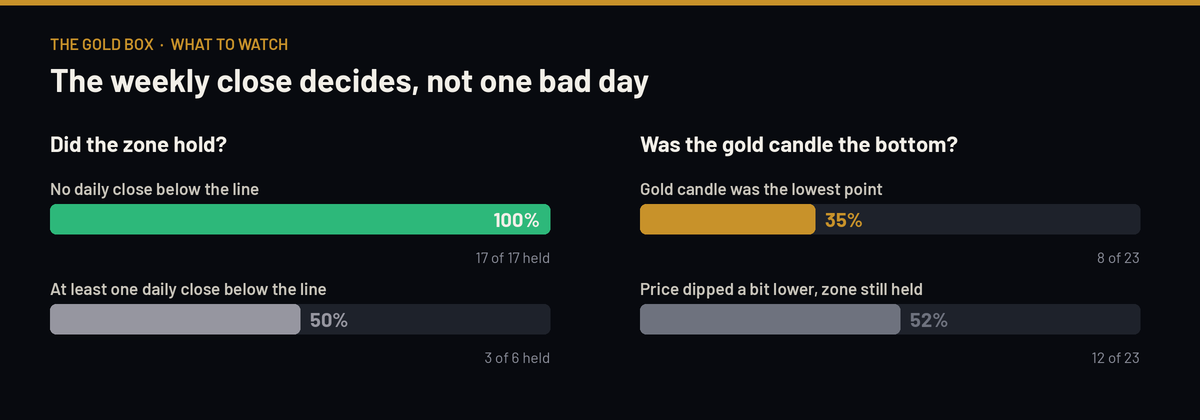
- The weekly close decides. A dashed orange line marks the bottom of each zone. A weekly close below it means the zone has failed.
- One daily close below the line is a warning, not a break. When that happened, the zone still held half the time. When it never happened, the zone held every time.
- The gold day is not the bottom. It was the lowest point only about a third of the time. More often price dipped a little further and the zone still held.
Right now: price tested the top of the zone at $77,800 to $81,300 on 8 October, calmly, with buyers the next day. That gold box gets decided at the weekly close on 1 November.
2. Strong and poor highs and lows
These read the futures footprint: every candle split into $10 price levels, showing how much was bought and sold at each one on Binance and Bybit.
S: a strong high or low
Heavy buying pushes price to a new high, then gets absorbed: the candle closes back near its low. A strong low is the same thing upside down.
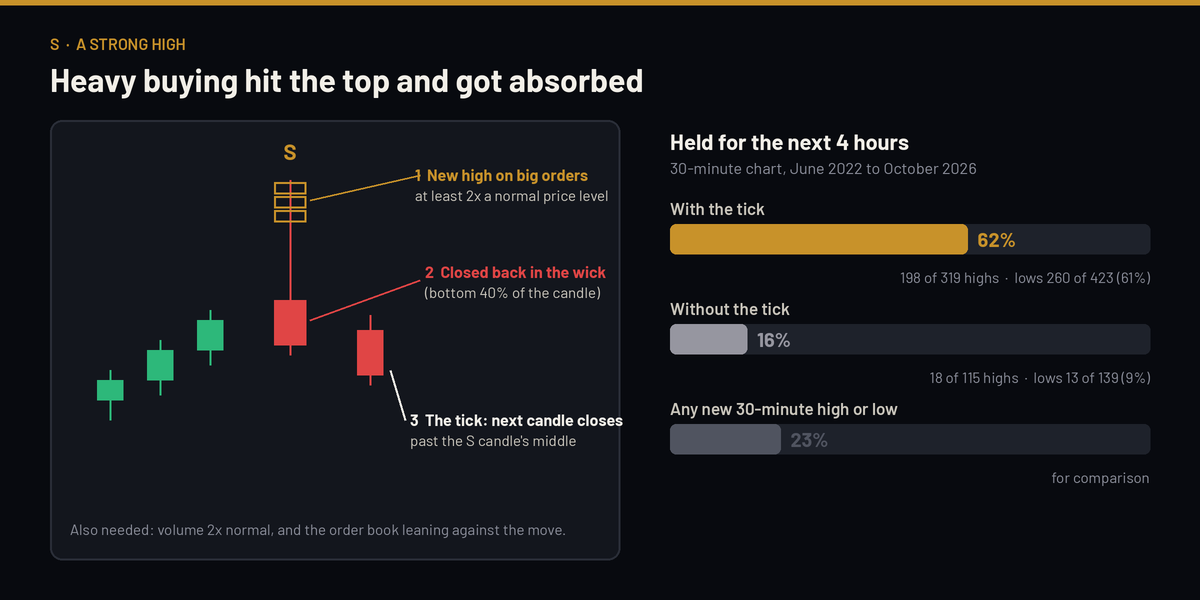
The part to wait for is the tick: the next candle confirming it. With the tick, the high or low held for the next four hours about 60% of the time, against 23% for any new high or low. Without the tick it held only 9% to 16% of the time. An S without its tick means nothing yet.
P: a poor high or low
At the very top of a move, buyers and sellers were both still trading. The auction did not finish, and price tends to come back to it.
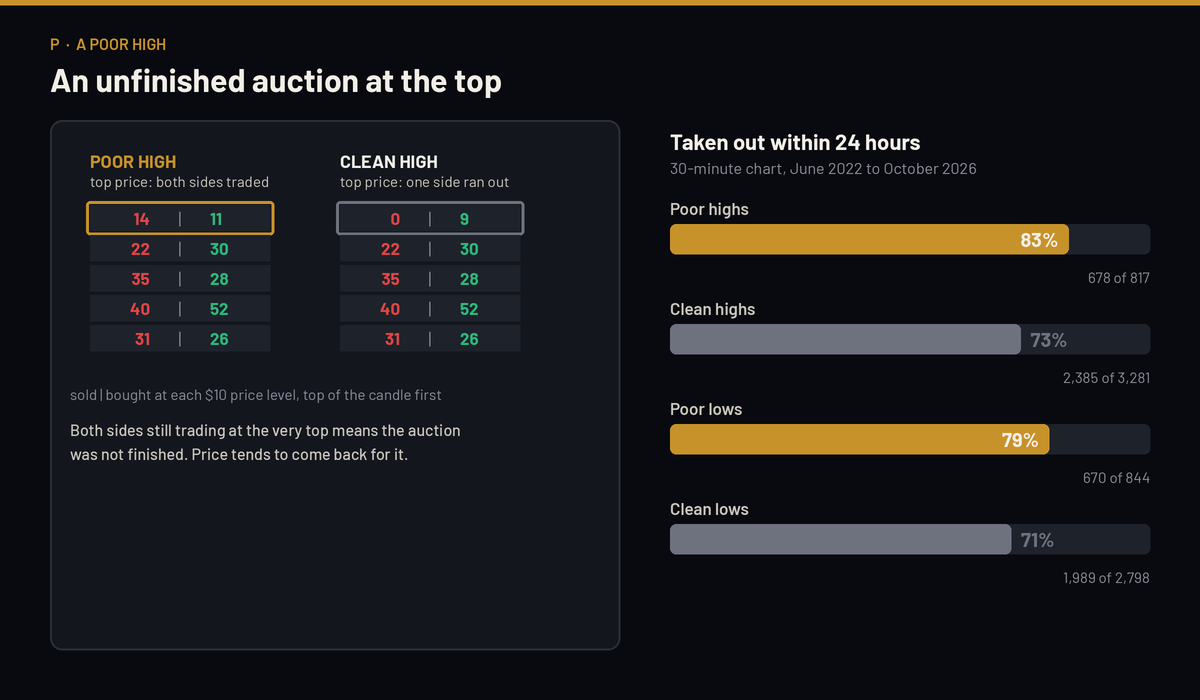
Poor highs were taken out within a day 83% of the time, against 73% for clean highs. Poor lows: 79% against 71%. A modest edge, but it held in four years out of five, back to 2022.
We run both on our own chart first and score every one live. They come to the Insider chart once the live record backs the history.
3. Footprint candles
In the Pro view, the candle choice reads Candles: Normal, Footprint futures, Footprint spot. Footprint shows who traded at each price inside the candle, with a short verdict under each one: did the buying or selling move price, or did it get soaked up? History now runs back to June 2022 on every timeframe from 15 minutes to weekly. The Simple view always shows normal candles.
4. Fewer flashes, better ones
We scored the first week of flashes against random moments. Most types did no better than a coin flip at saying which way price went next. A ping that is right half the time trains you to ignore the ones that matter.
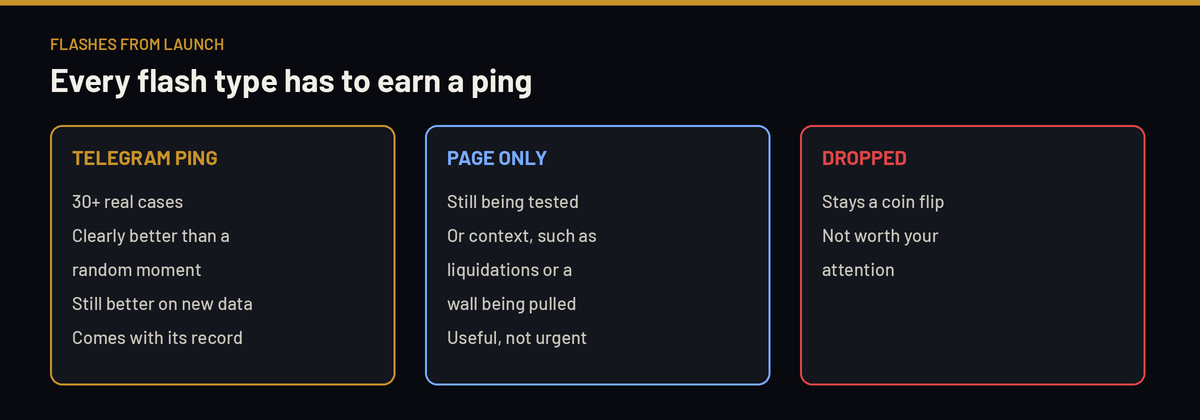
We sort every flash type with two weeks of results at the end of October. Expect fewer pings from launch, and the ones you get will show their record.
5. Smaller changes
- Your journal now works in full screen.
- Oz can post his read of the chart, with a snapshot, straight from The Tape into the Oz Updates topic.
- The futures footprint uses Binance and Bybit together. Bybit on its own gave more marks but weaker ones, so we kept both.
The Tape opens on 29 October for Alpha Insider members. The full order book page, the gold box on the weekly zones, live flashes in your private Telegram, and every result scored in the open. See the plans.
Legal and risk notice: The Tape shows where orders are waiting and what happened after similar setups in the past. Past records are not a forecast, and nothing here is financial advice or an instruction to trade.


Discussion