


Altcoins have been in a holding pattern for over a year now, if you were'nt invested in the MEME coins then perhaps your alts have done badly. Let's take a look at the charts and see if altcoins are making any moves.
Fibonacci Levels
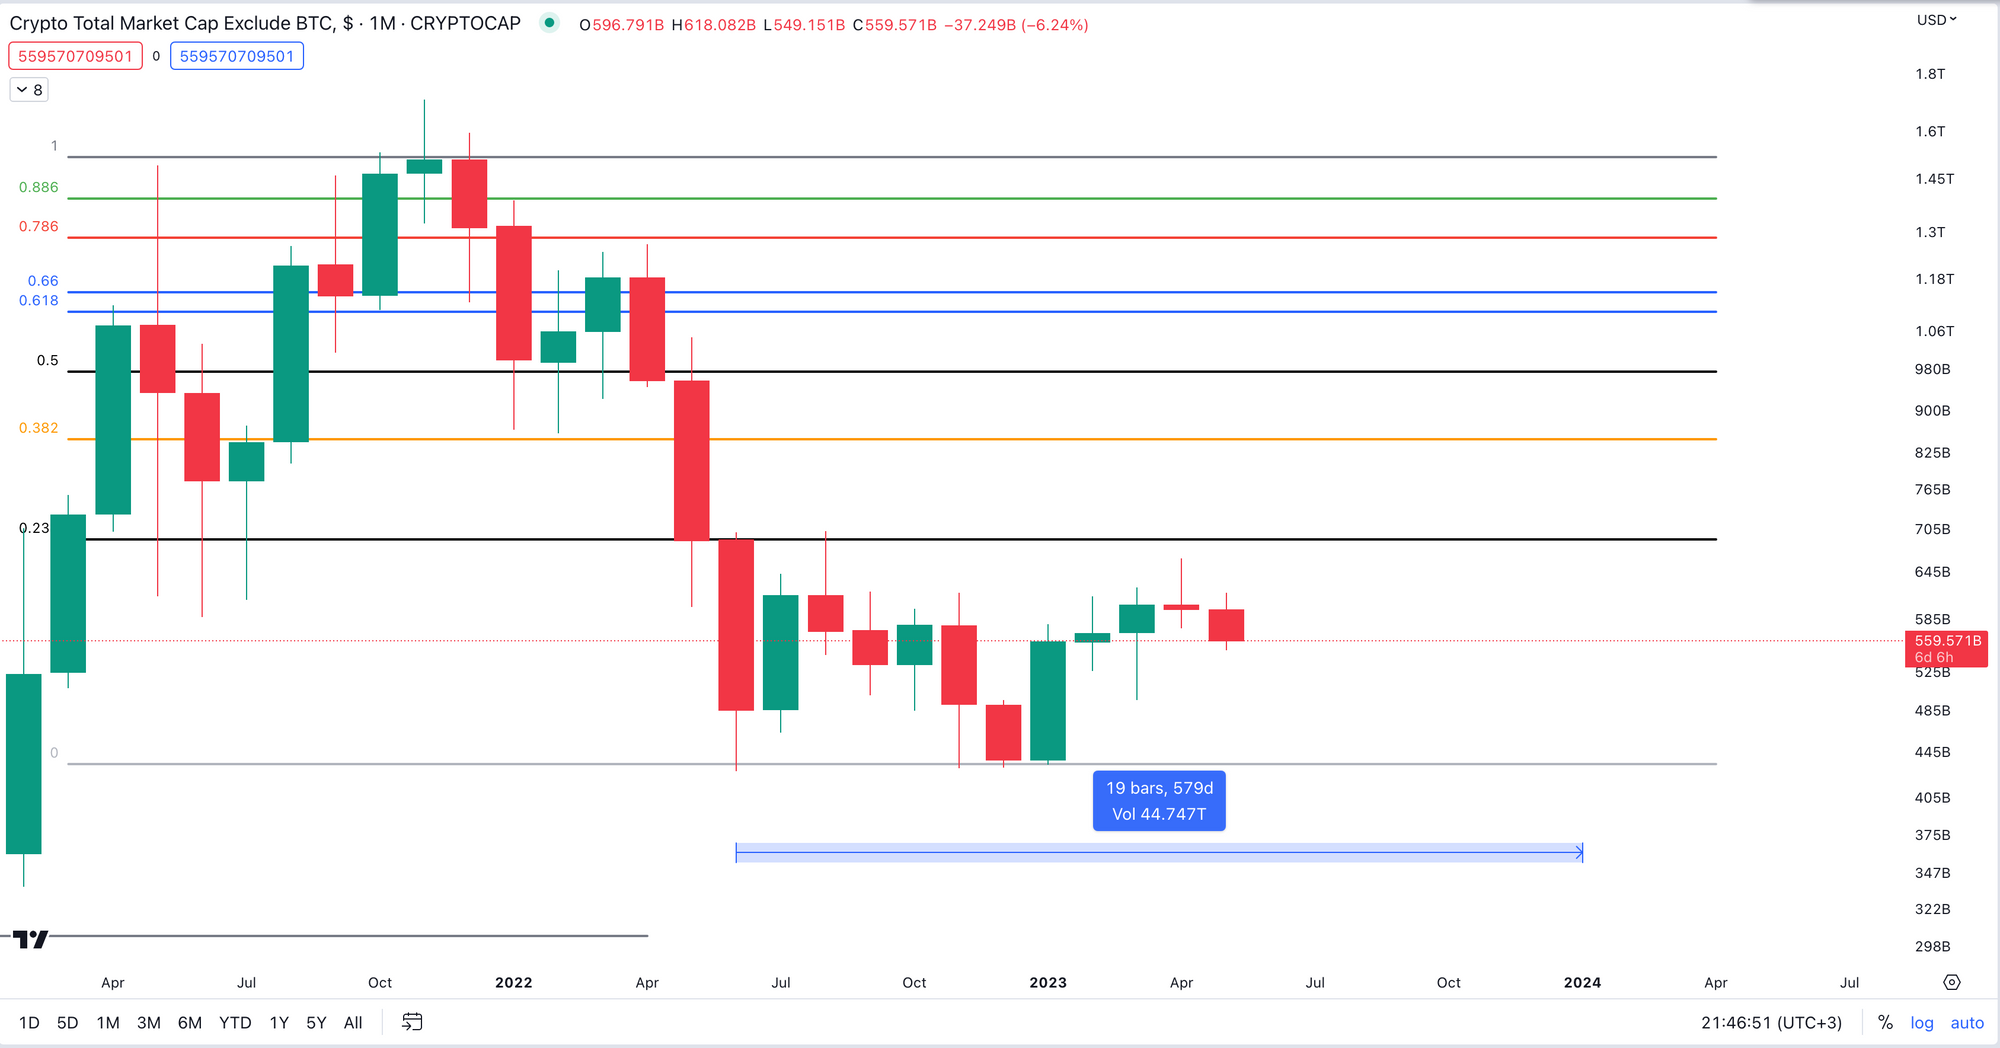
Since the bottom of Total2 in June 2022 which represents the total market cap of all of the altcoins in crypto, the 0.236 level has proved difficult to break rejecting price on two occasions. In the past the altcoin accumulation phase has taken around 570 days, if that were to happen again we can expect the altcoin accumulation phase to continue until the end of the year.
However, once the 0.236 level has been broken which stands at around $690 billion, we will start to see the altcoin market take off.
Key Moving Averages
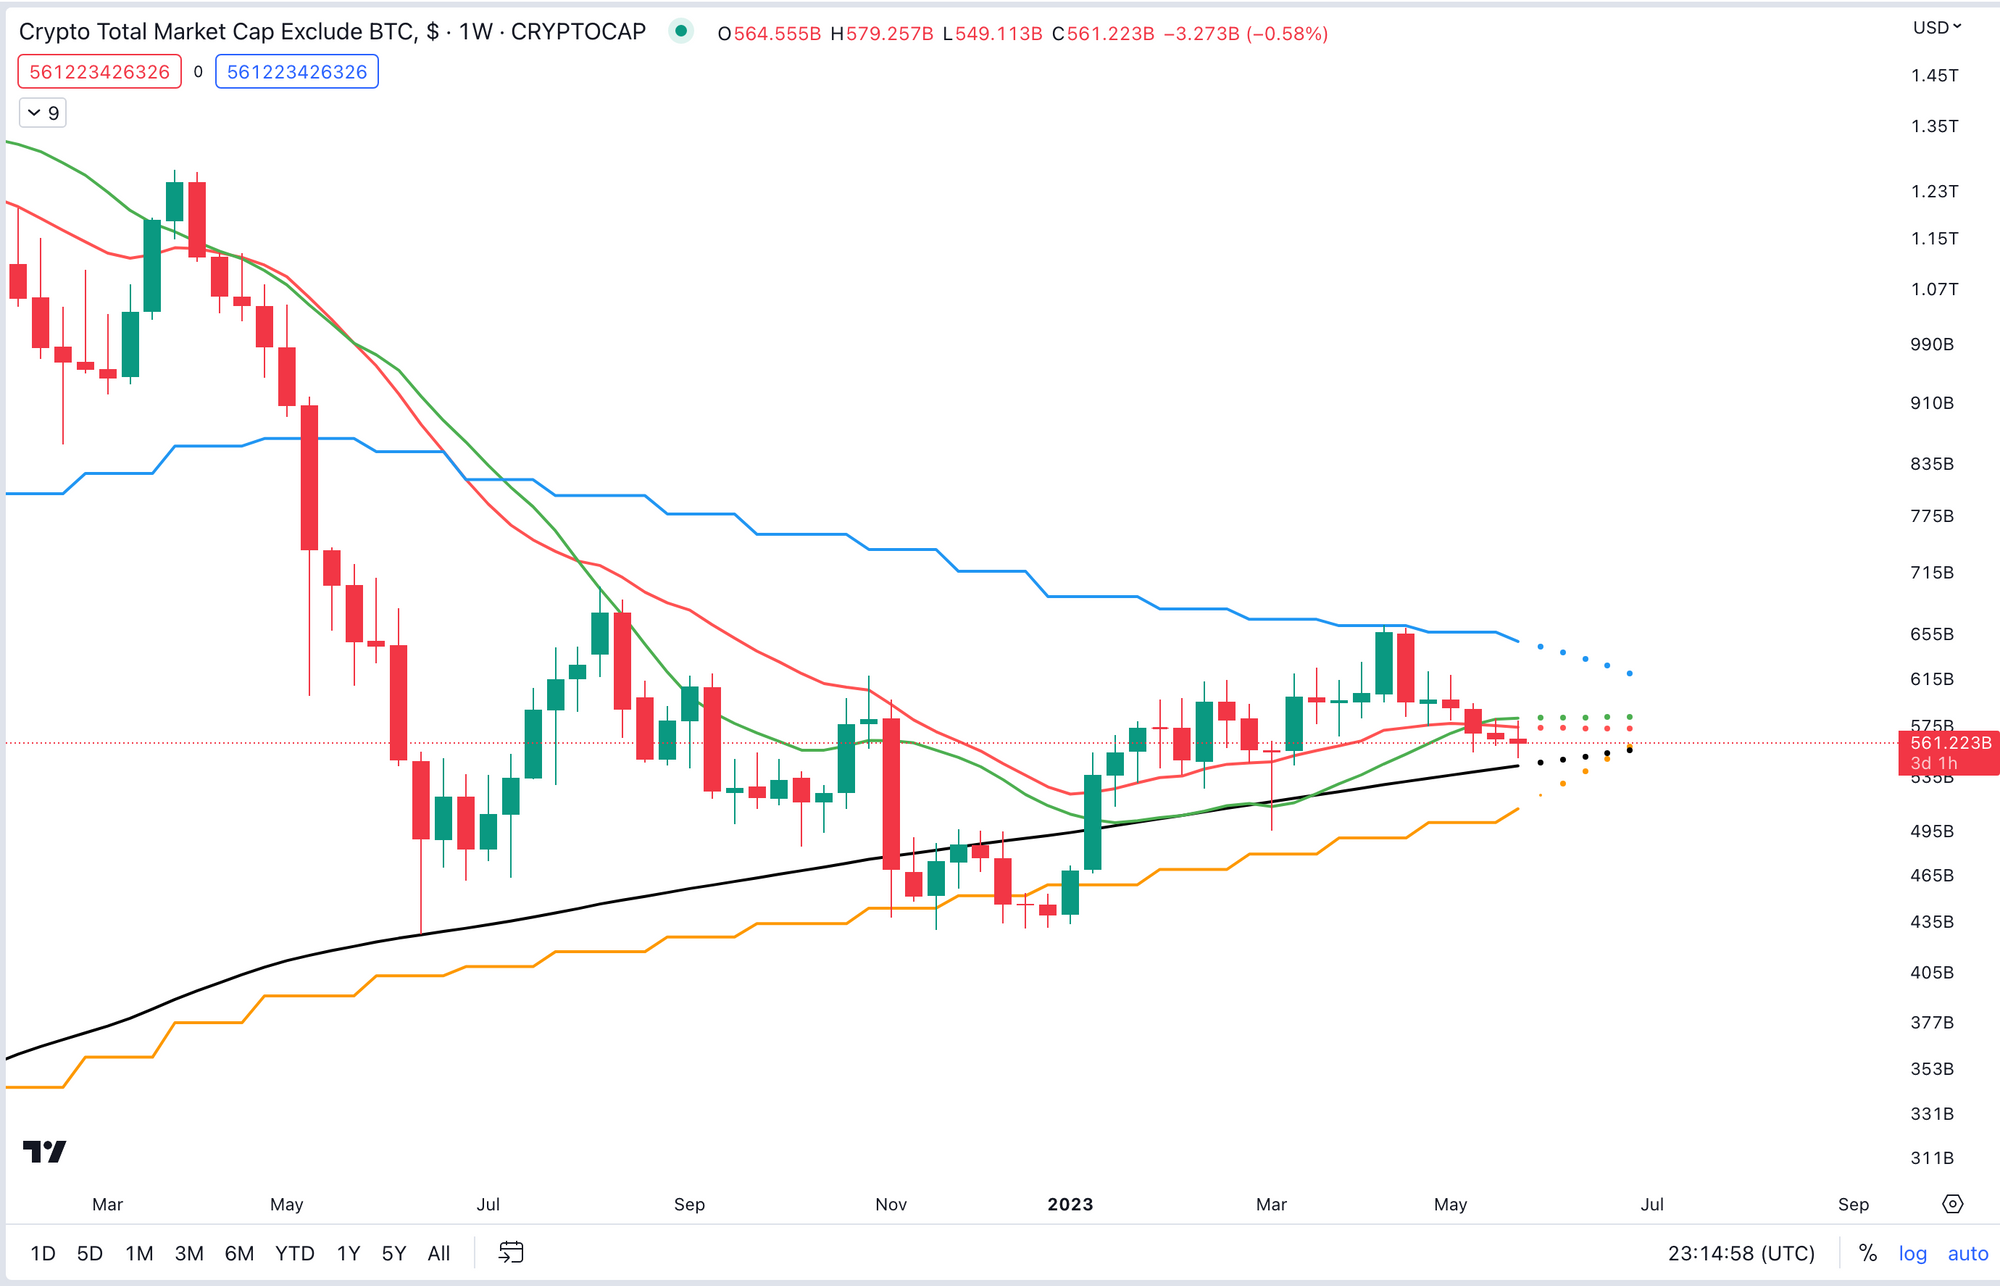
Looking at the key moving averages, once price is around the 50 Monthly MA (yellow) it's one of the best times to buy altcoins. The last time price hit this level was in November 2022 and before that was back in April 2020 during the covid crash. Price action is telling me an accumulation phase is going on. Several months of price action above the 21 monthly MA (blue) will indicate that the accumulation phase has ended and price is ready to push forward.
Legal And Risk Notice
This article is for education only and is not financial, investment or legal advice. Crypto assets are volatile and you can lose some or all of the money you put in. Do your own research and consider independent advice before making any financial decision.
Which altcoins are beating Bitcoin over 13 weeks, ranked every week. The top three are public; the full board comes with Alpha Pro.
See the board➡️ Kairos timing windows to plan entries before the crowd moves
➡️ A full DCA Targets page with levels mapped for this cycle
➡️ Exclusive member videos breaking down charts in plain English
➡️ A private Telegram community where conviction is shared daily


Discussion