


Earlier today I wrote about the dominance call I got wrong, and the Altseason Dashboard I built from it. This one goes a level deeper.
The dashboard ranks its readings by importance. Tier 1 is the five readings that best separated the real alt seasons from the one that wasn't. Here they are, with the numbers from the week each season began. In the chart at the top, gold means the reading was in place that week, and the bottom row is how far Bitcoin dominance fell during the season.
First, what counts as real
Since 2015 the altcoin market (Others, everything outside the top ten) has had six big runs. In five of them, alts beat Bitcoin: dominance fell between 4 and 37 points. In the sixth, 2023-25, alts rose 3.5x in dollars and dominance moved one point. Alts went up with Bitcoin. They didn't beat it.
So the useful question is narrow: what did the five have at the start that 2023-25 didn't?
1. Real yield: the cleanest split
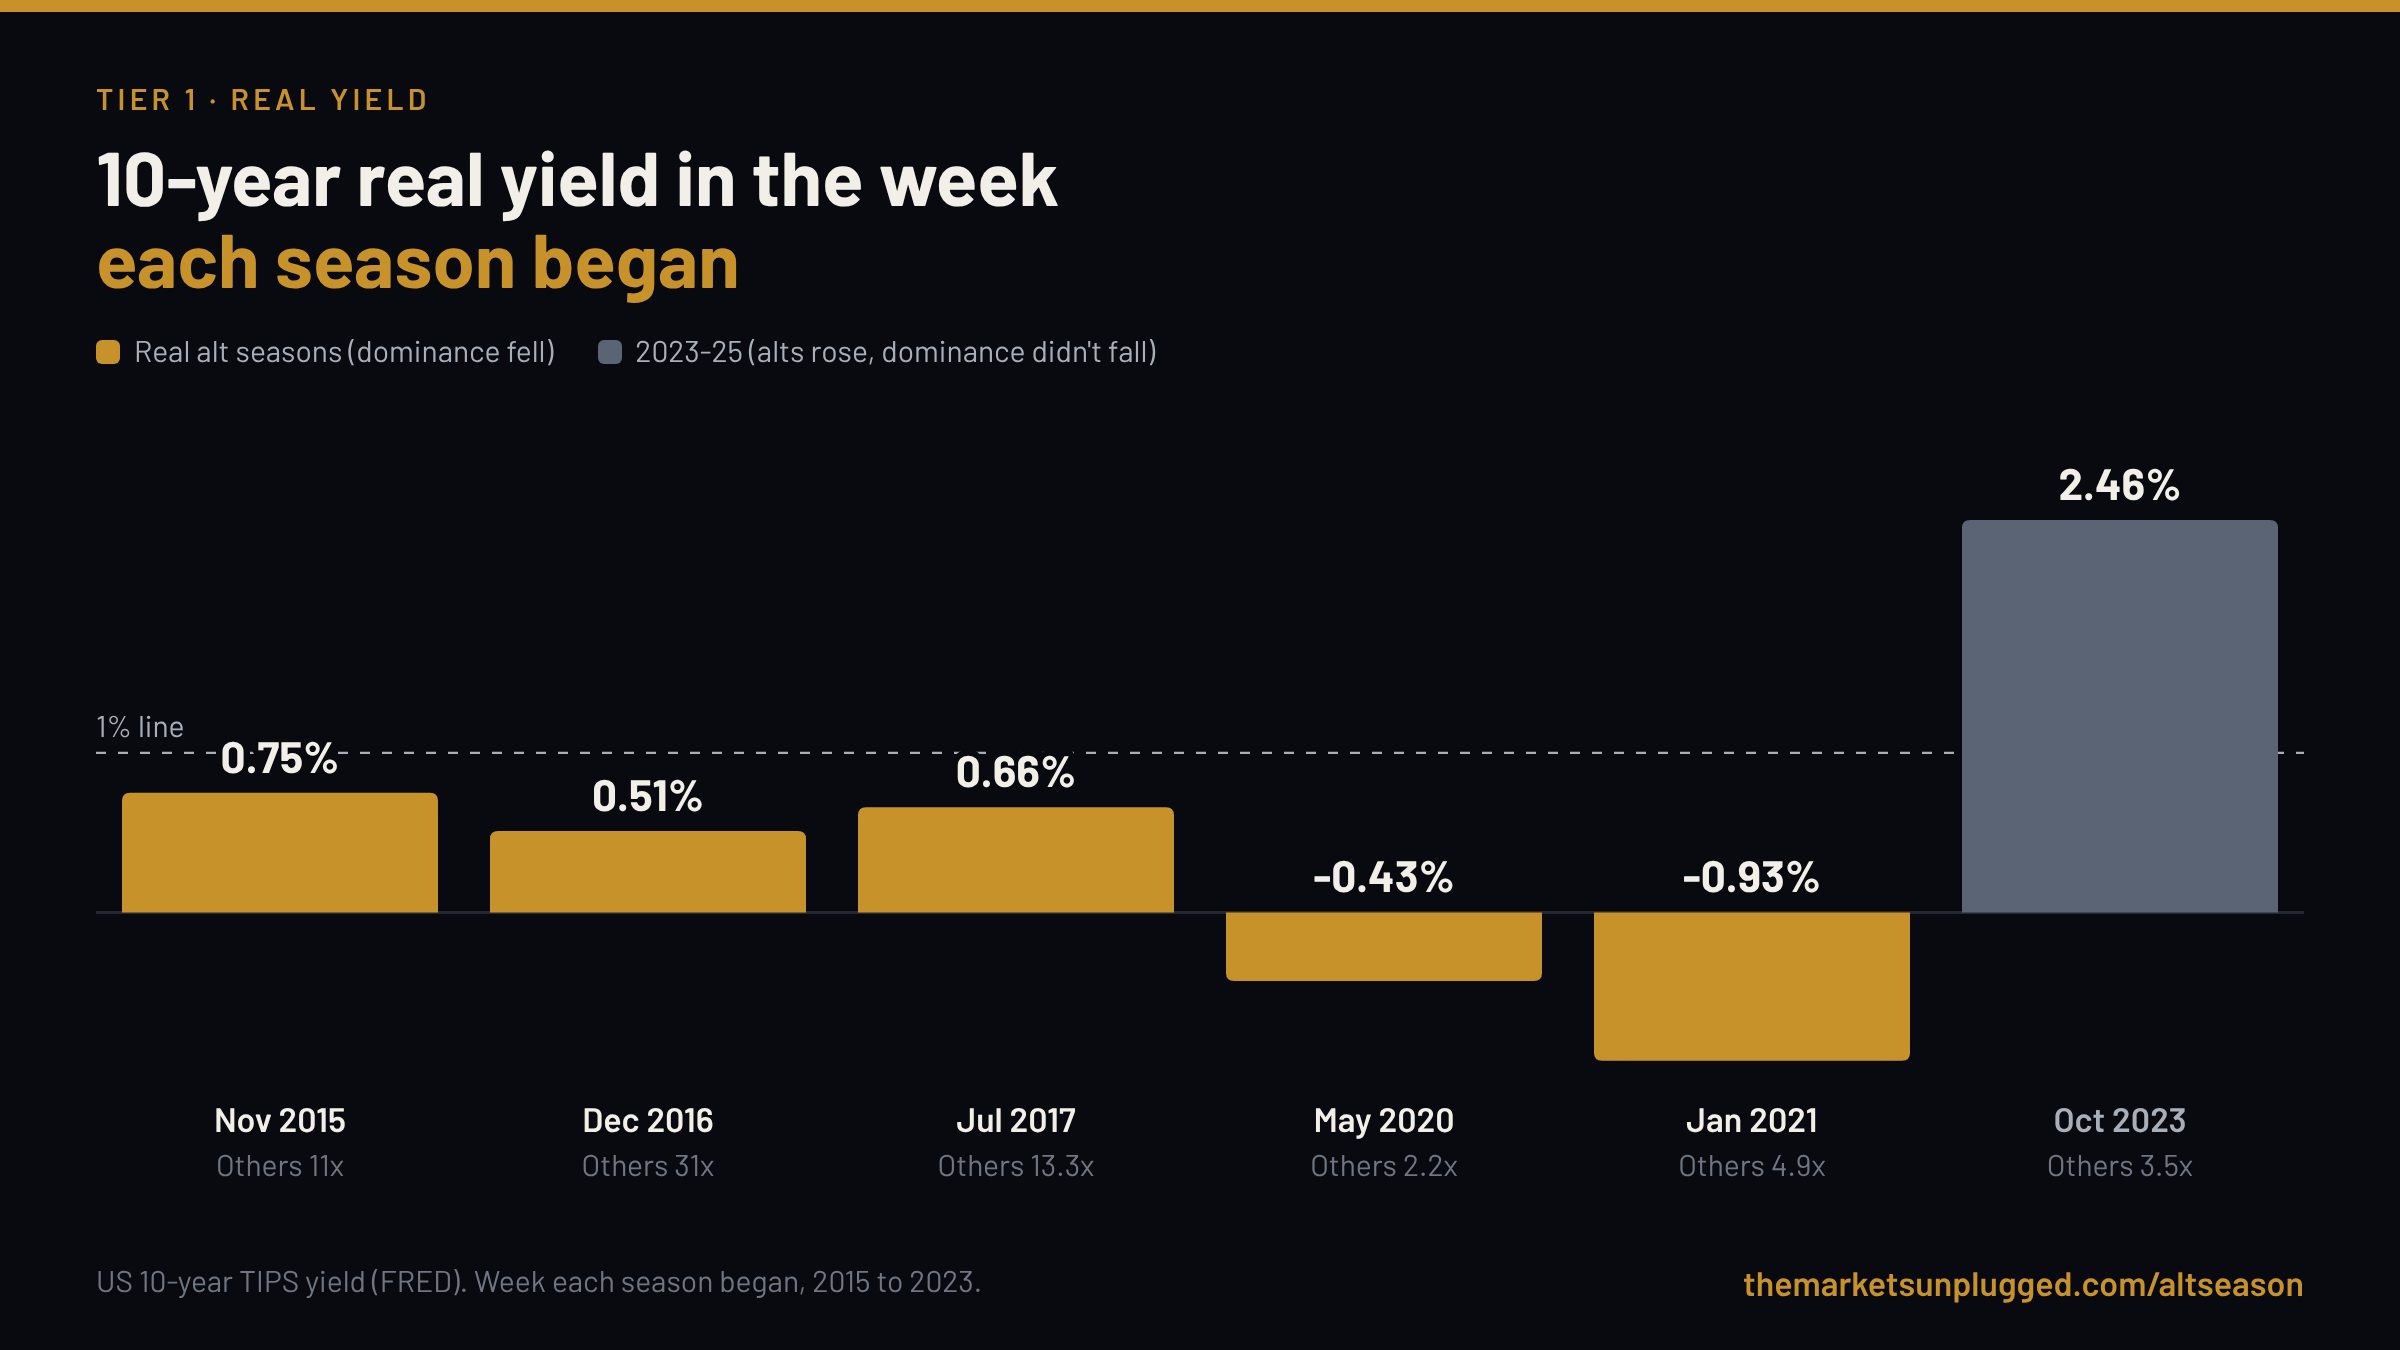
The 10-year real yield is what a safe US government bond pays after inflation. When it's low, holding cash and bonds pays little, and money goes looking for risk. All five real seasons began with it under 1%, two of them below zero. 2023-25 began at 2.46%.
The honest caveat: every one of those low-yield weeks also came before the spot Bitcoin ETFs, which pulled new money into Bitcoin only. The record can't tell those two apart. It's the strongest split in the data, not proof of cause.
2. Stablecoins: new cash on the exchanges
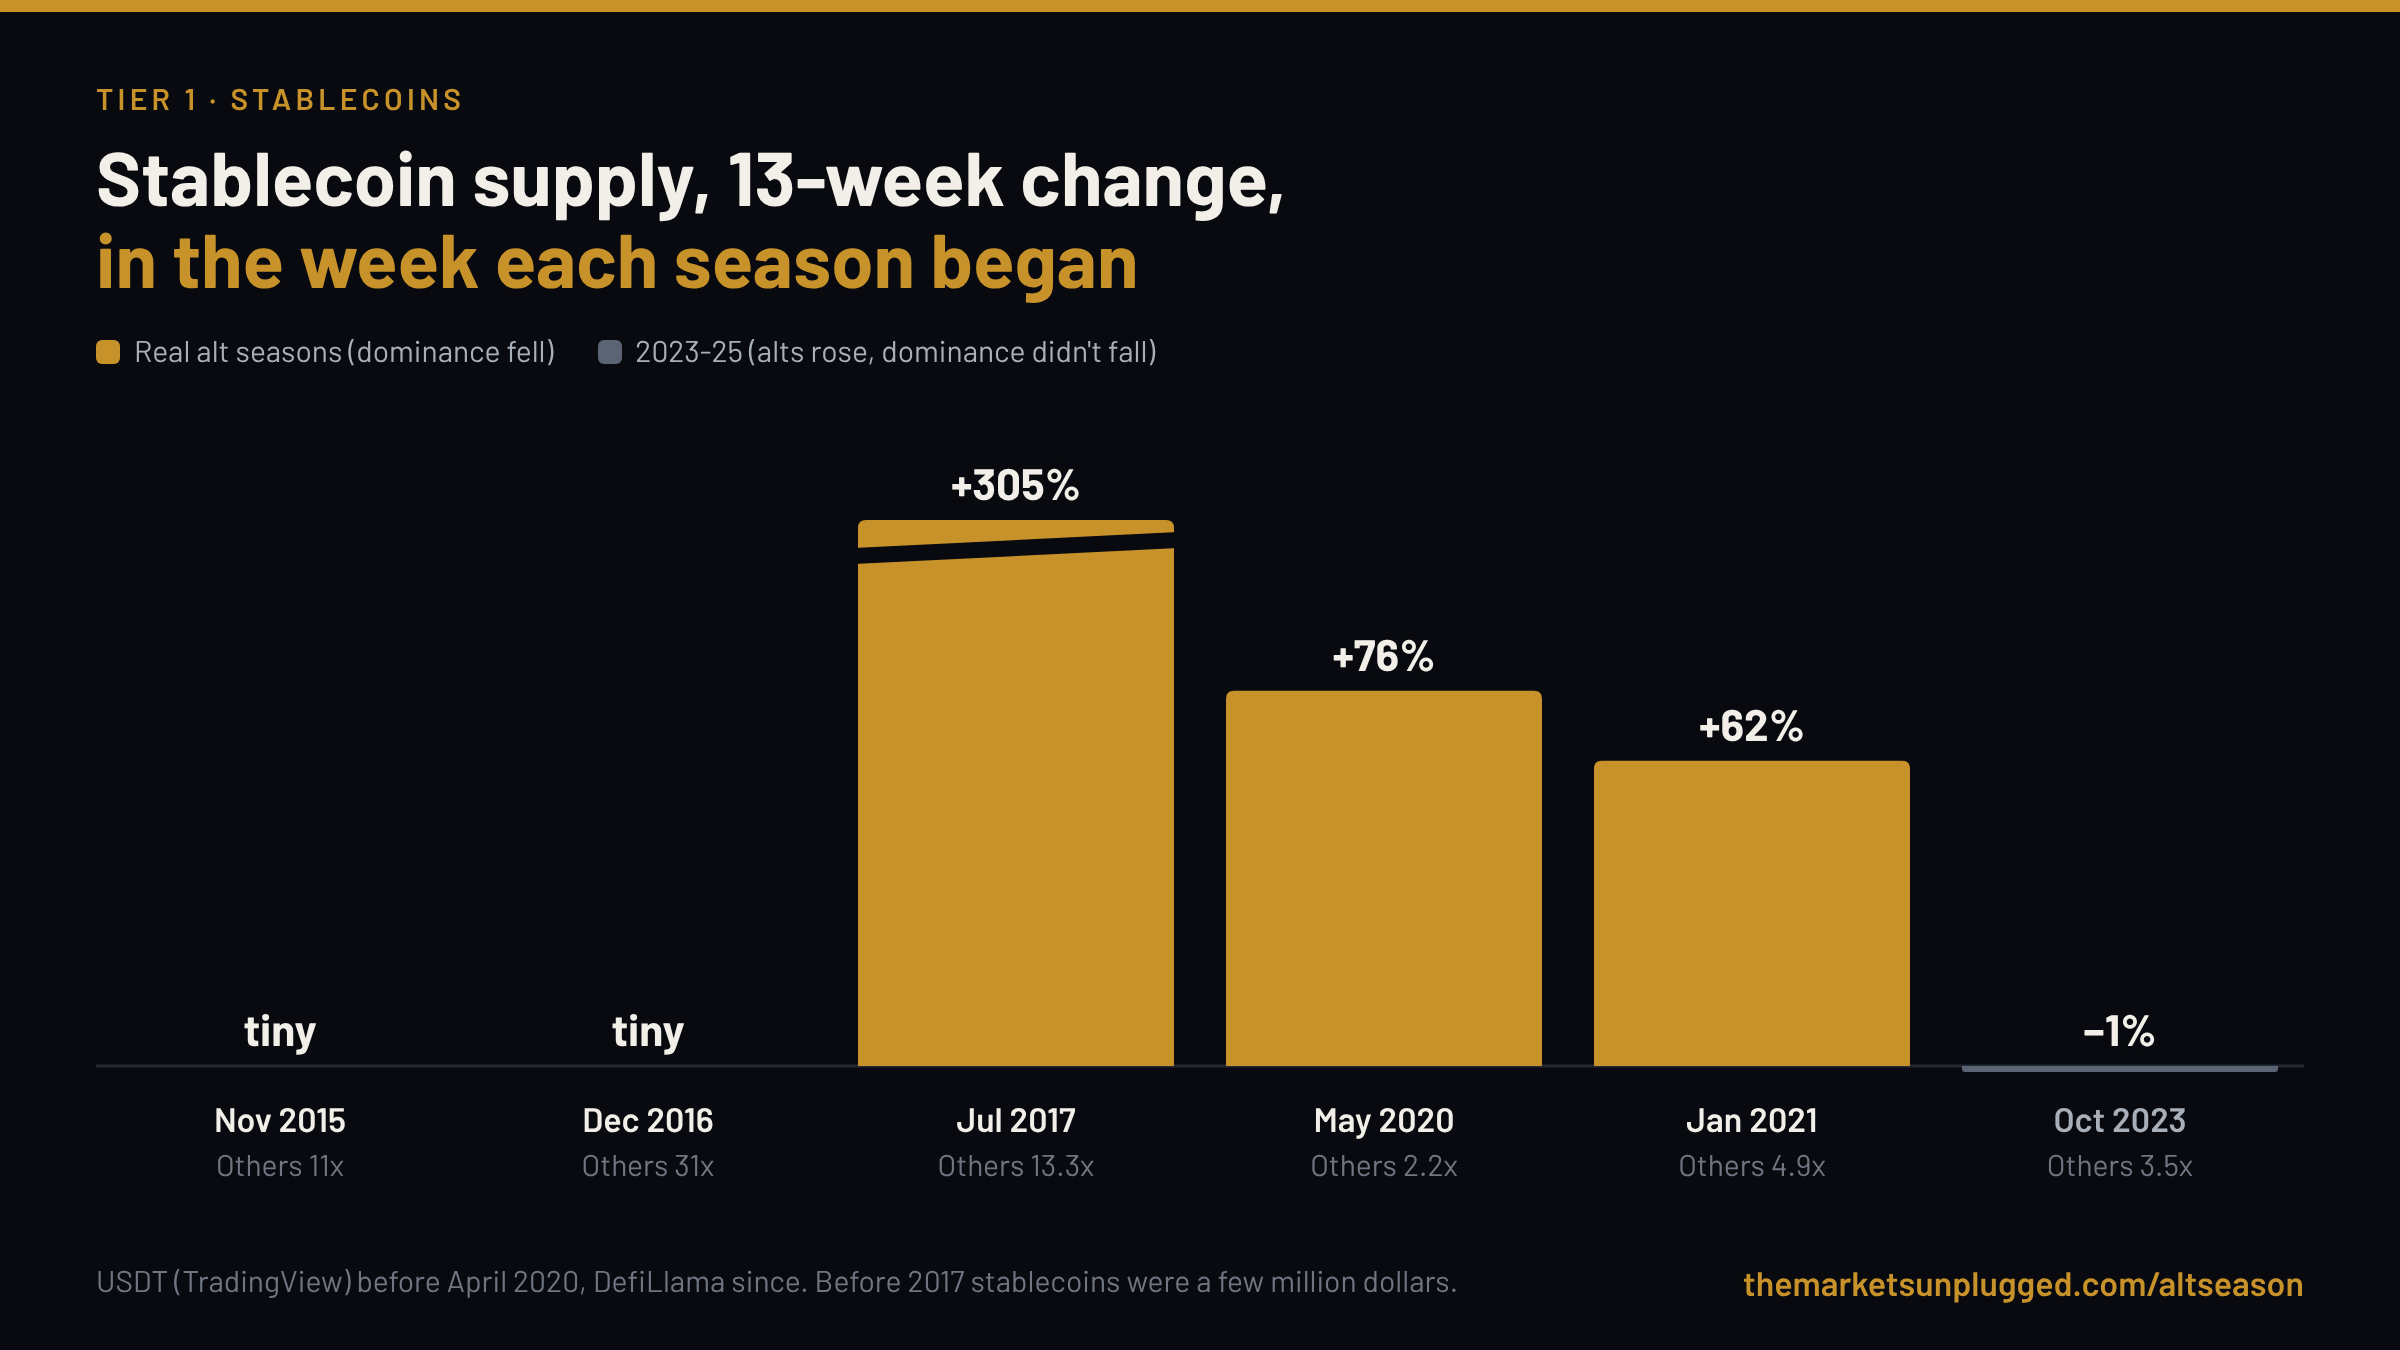
Stablecoins are the dollars sitting inside crypto, ready to be spent. Before 2017 the market was a few million dollars, so the first two seasons tell us nothing here. In the three cycles where stablecoins mattered, supply grew 62% to 305% in the 13 weeks before the season began. In 2023-25 it shrank 1%.
Which coins grow matters too. In 2022 much of the growth was UST, backed by a yield promise rather than dollars, and it came before the collapse, not a season.
3 and 4. MVRV and realised price: how hard buyers are paying up
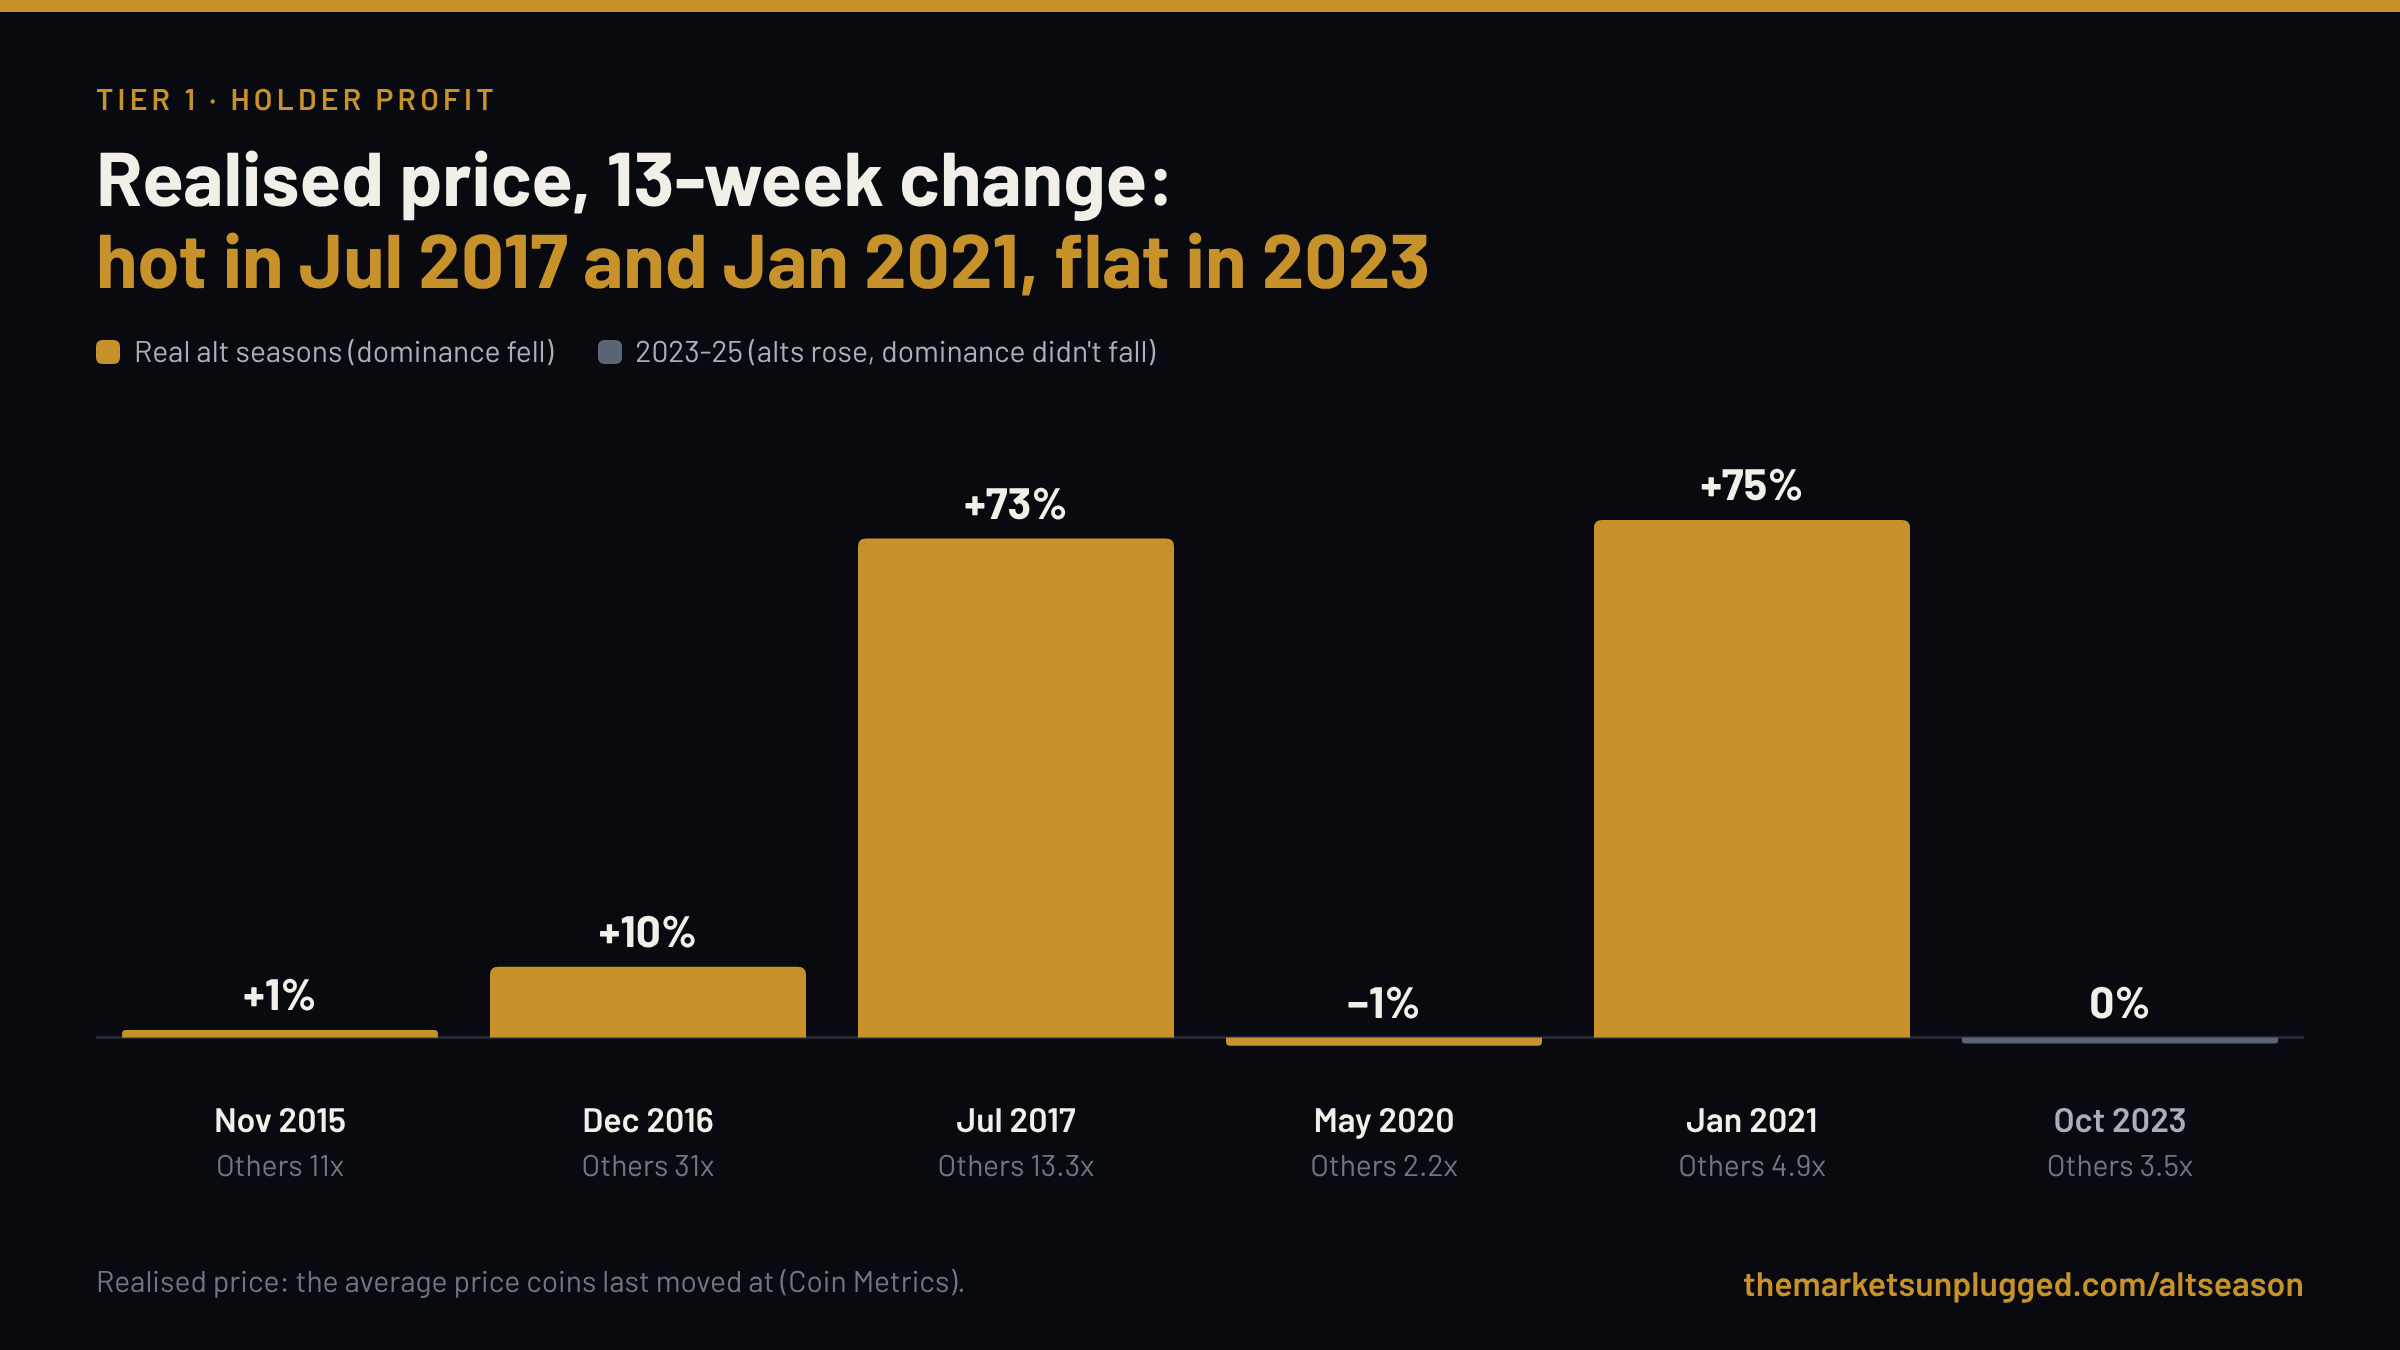
Realised price is the average price every Bitcoin last moved at, roughly what holders paid. MVRV is price divided by realised price: how much profit the average holder is sitting on.
These two ran hot at the start of July 2017 (MVRV 2.72, realised price up 73% in 13 weeks) and January 2021 (3.48, up 75%). That's new money paying up for Bitcoin fast, and in both cases it spilled into alts: dominance fell 37 and 28 points. Both began with Bitcoin within 15% of its high.
They aren't needed for a season to start. December 2016 began cool (MVRV 1.89) and dominance still fell 32 points. 2023-25 began at 1.47 with realised price flat.
5. Supply in profit: a floor, not a switch
Supply in profit is the share of all Bitcoin worth more today than when it last moved. It was high at every season start with data: 89%, 87%, 71% and 96%. The lowest of any start was 71%, in DeFi 2020.
But 2023-25 began at 77%. So on its own it didn't separate the fake season from the real ones. It reads better as a floor: the real seasons didn't start while most holders were underwater.
What 2023-25 had, and what it was missing
Of the five Tier 1 readings, 2023-25 had one: supply in profit. Real yield was high, stablecoins were shrinking and holders weren't paying up. Alts still rose 3.5x in dollars, because Bitcoin did. Alts never beat it.
That's the lesson from my October miss. A chart can show dominance at a level that broke before. It can't tell you whether the money that broke it last time is there this time.
The small print, stated plainly: this is six seasons, and the dividing lines were chosen after looking at them. It's a checklist built from history, not a forecast. Any one of these readings can be in place without a season following.
Alpha Insider members see this week's column next to all six seasons, updated daily. You get every reading, a dot on each sign that's on, the low and trigger stages as well as the fuel, a similarity score, and the past season this week looks most like. Everyone can see the six seasons on the page.
See Alpha Insider See the six seasonsOz
Sources: Others and dominance (TradingView, CoinGecko-linked since October 2026), 10-year real yield (FRED), stablecoins (USDT from TradingView before April 2020, DefiLlama since), realised price and MVRV (Coin Metrics), supply in profit (ChartInspect). Readings are for the week each season began.
Legal And Risk Notice
This post describes past market data and is not a forecast. It is not financial advice or a recommendation to buy or sell anything. Crypto is volatile and you can lose all of what you put in. Do your own research.


Discussion