


You've seen the screenshot. A huge sell wall sits just above Bitcoin, everyone on X calls it the ceiling, and then price walks straight through it.
Often nobody broke that wall. The orders were cancelled before price got there.
The order book bluffs
Since 15 October we've recorded the Bitcoin order book on five exchanges around the clock: Binance, Coinbase, Kraken, Bitstamp and Bitfinex. Then we followed every big order (30 BTC or more) sitting close to the price, to see where it went.
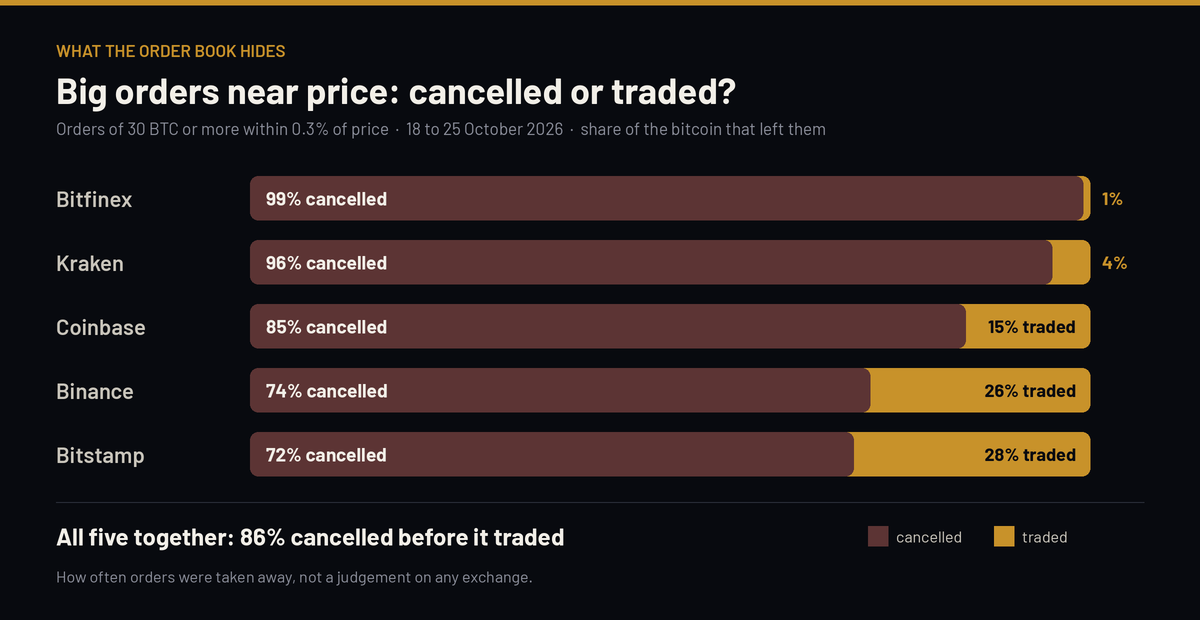
In the last seven days, 86% of the bitcoin that left those orders was cancelled before it traded. On two of the five exchanges it was nearly all of it.
So the size of a wall tells you very little. The useful question is a different one: which levels have held before, and how often?
A real one from last week
Monday 19 October, 09:20 UK. Price pushed above a sell wall of 343 BTC at $82,600. When price got there, about 42 BTC traded. The other 301 BTC was pulled or moved.
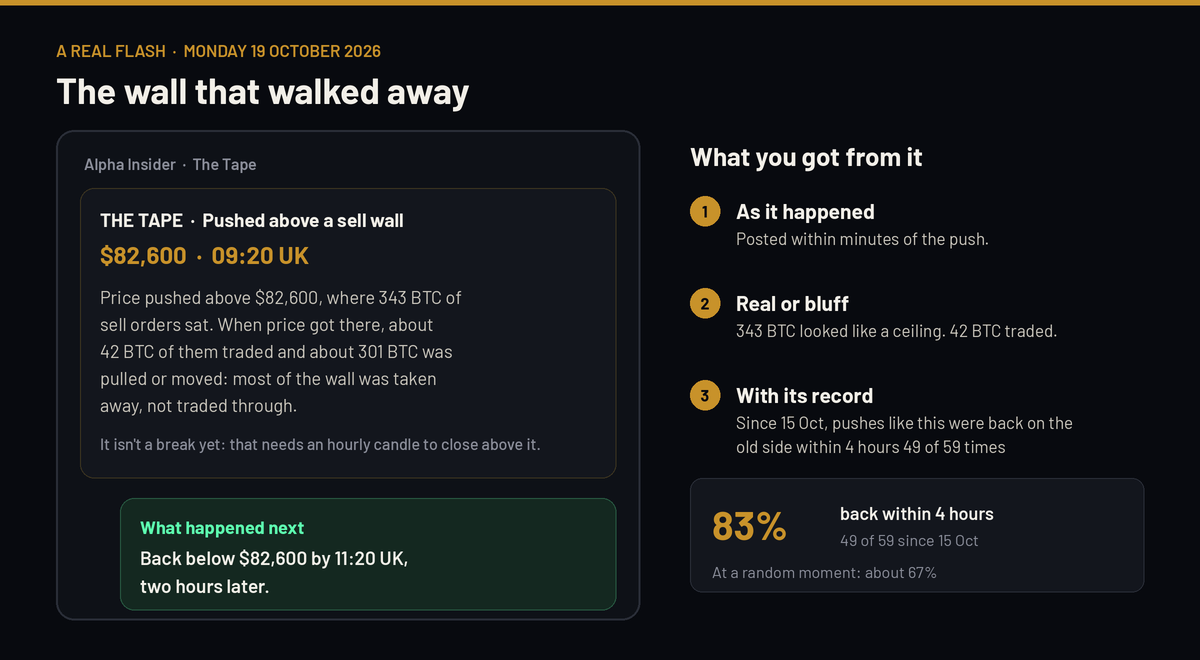
Two hours later, price was back below $82,600. Since 15 October, pushes through a wall like this were back on the old side within four hours in 49 of 59 cases (83%). At a random moment the same move happens about 67% of the time. The gap is real, and smaller than the headline number. We show you both.
Levels with years of history
Some patterns have held up across years of data. One is a calm test of a weekly buy zone: price drifts down into the area where buy orders built up over the week, on normal volume, and futures buyers lead the next day.
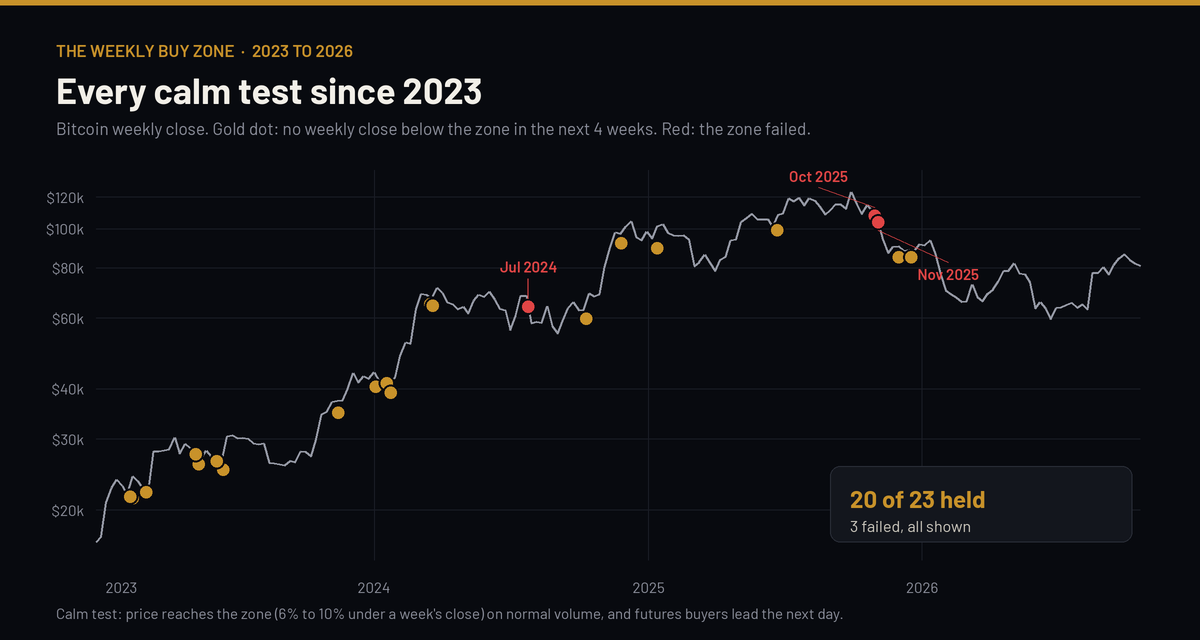
Since 2023 that happened 23 times. In 20 of them, no week closed below the zone over the next four weeks. The three that failed are on the chart too, because knowing what a failure looks like matters as much.
Four moments, four records
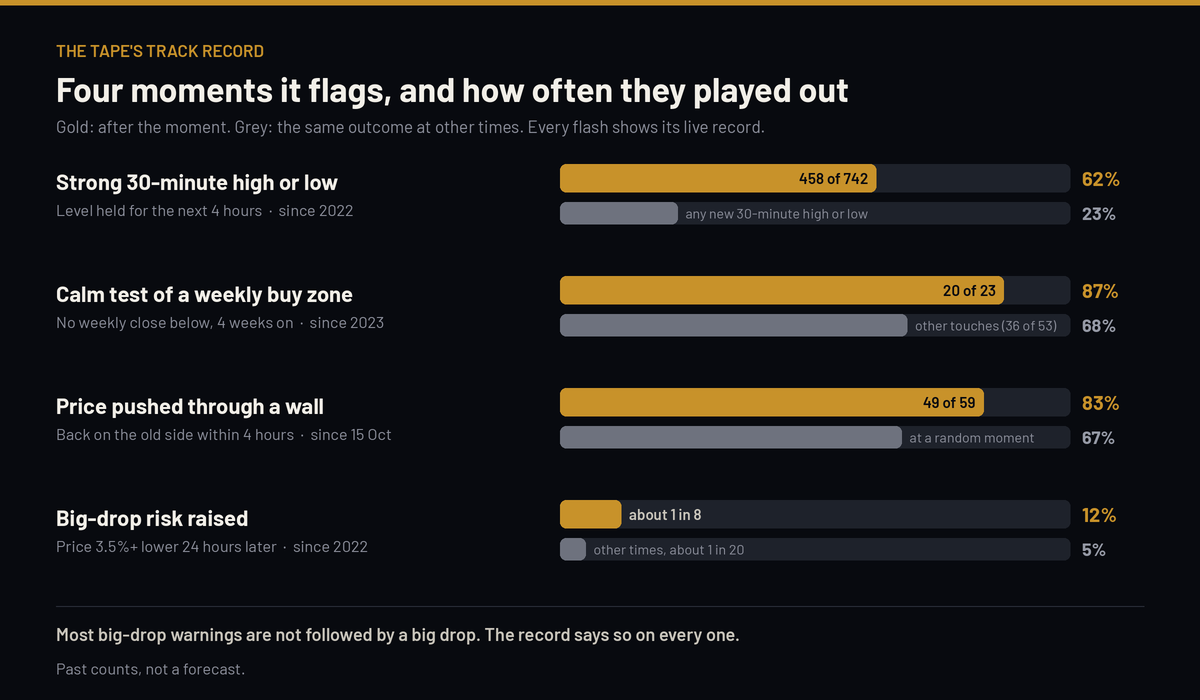
Each of these comes with its own record when it fires, recounted every time a new case is scored. Some records are modest, and we say so. Price was 3.5% or more lower 24 hours after a big-drop warning about 1 time in 8, against 1 in 20 at other times. Worth knowing, and no reason to panic.
What opens on Thursday 29 October
The Tape opens to Alpha Insider members. It does the watching for you:
- The live order book across five exchanges, with how often orders on each one get pulled
- Flashes to your phone for the key moments, with the tested ones carrying their live record
- A follow-up with what happened next, holds and breaks alike
- The 8am write-up and the weekly buy zone watch
Alpha Insider also includes the weekly members video with Oz and Doc, Ask Doc or Oz, and the private Telegram group. Alpha Lite and Alpha Pro members get the weekly Tape email every Monday.
|
The Tape · Alpha Insider · from 29 October See which levels are real, as it happens.
|
The Tape shows where orders wait and what really trades. It doesn't tell you where price goes next, and nothing here is advice to buy or sell. Every figure is a past count, not a forecast.
Oz


Discussion