


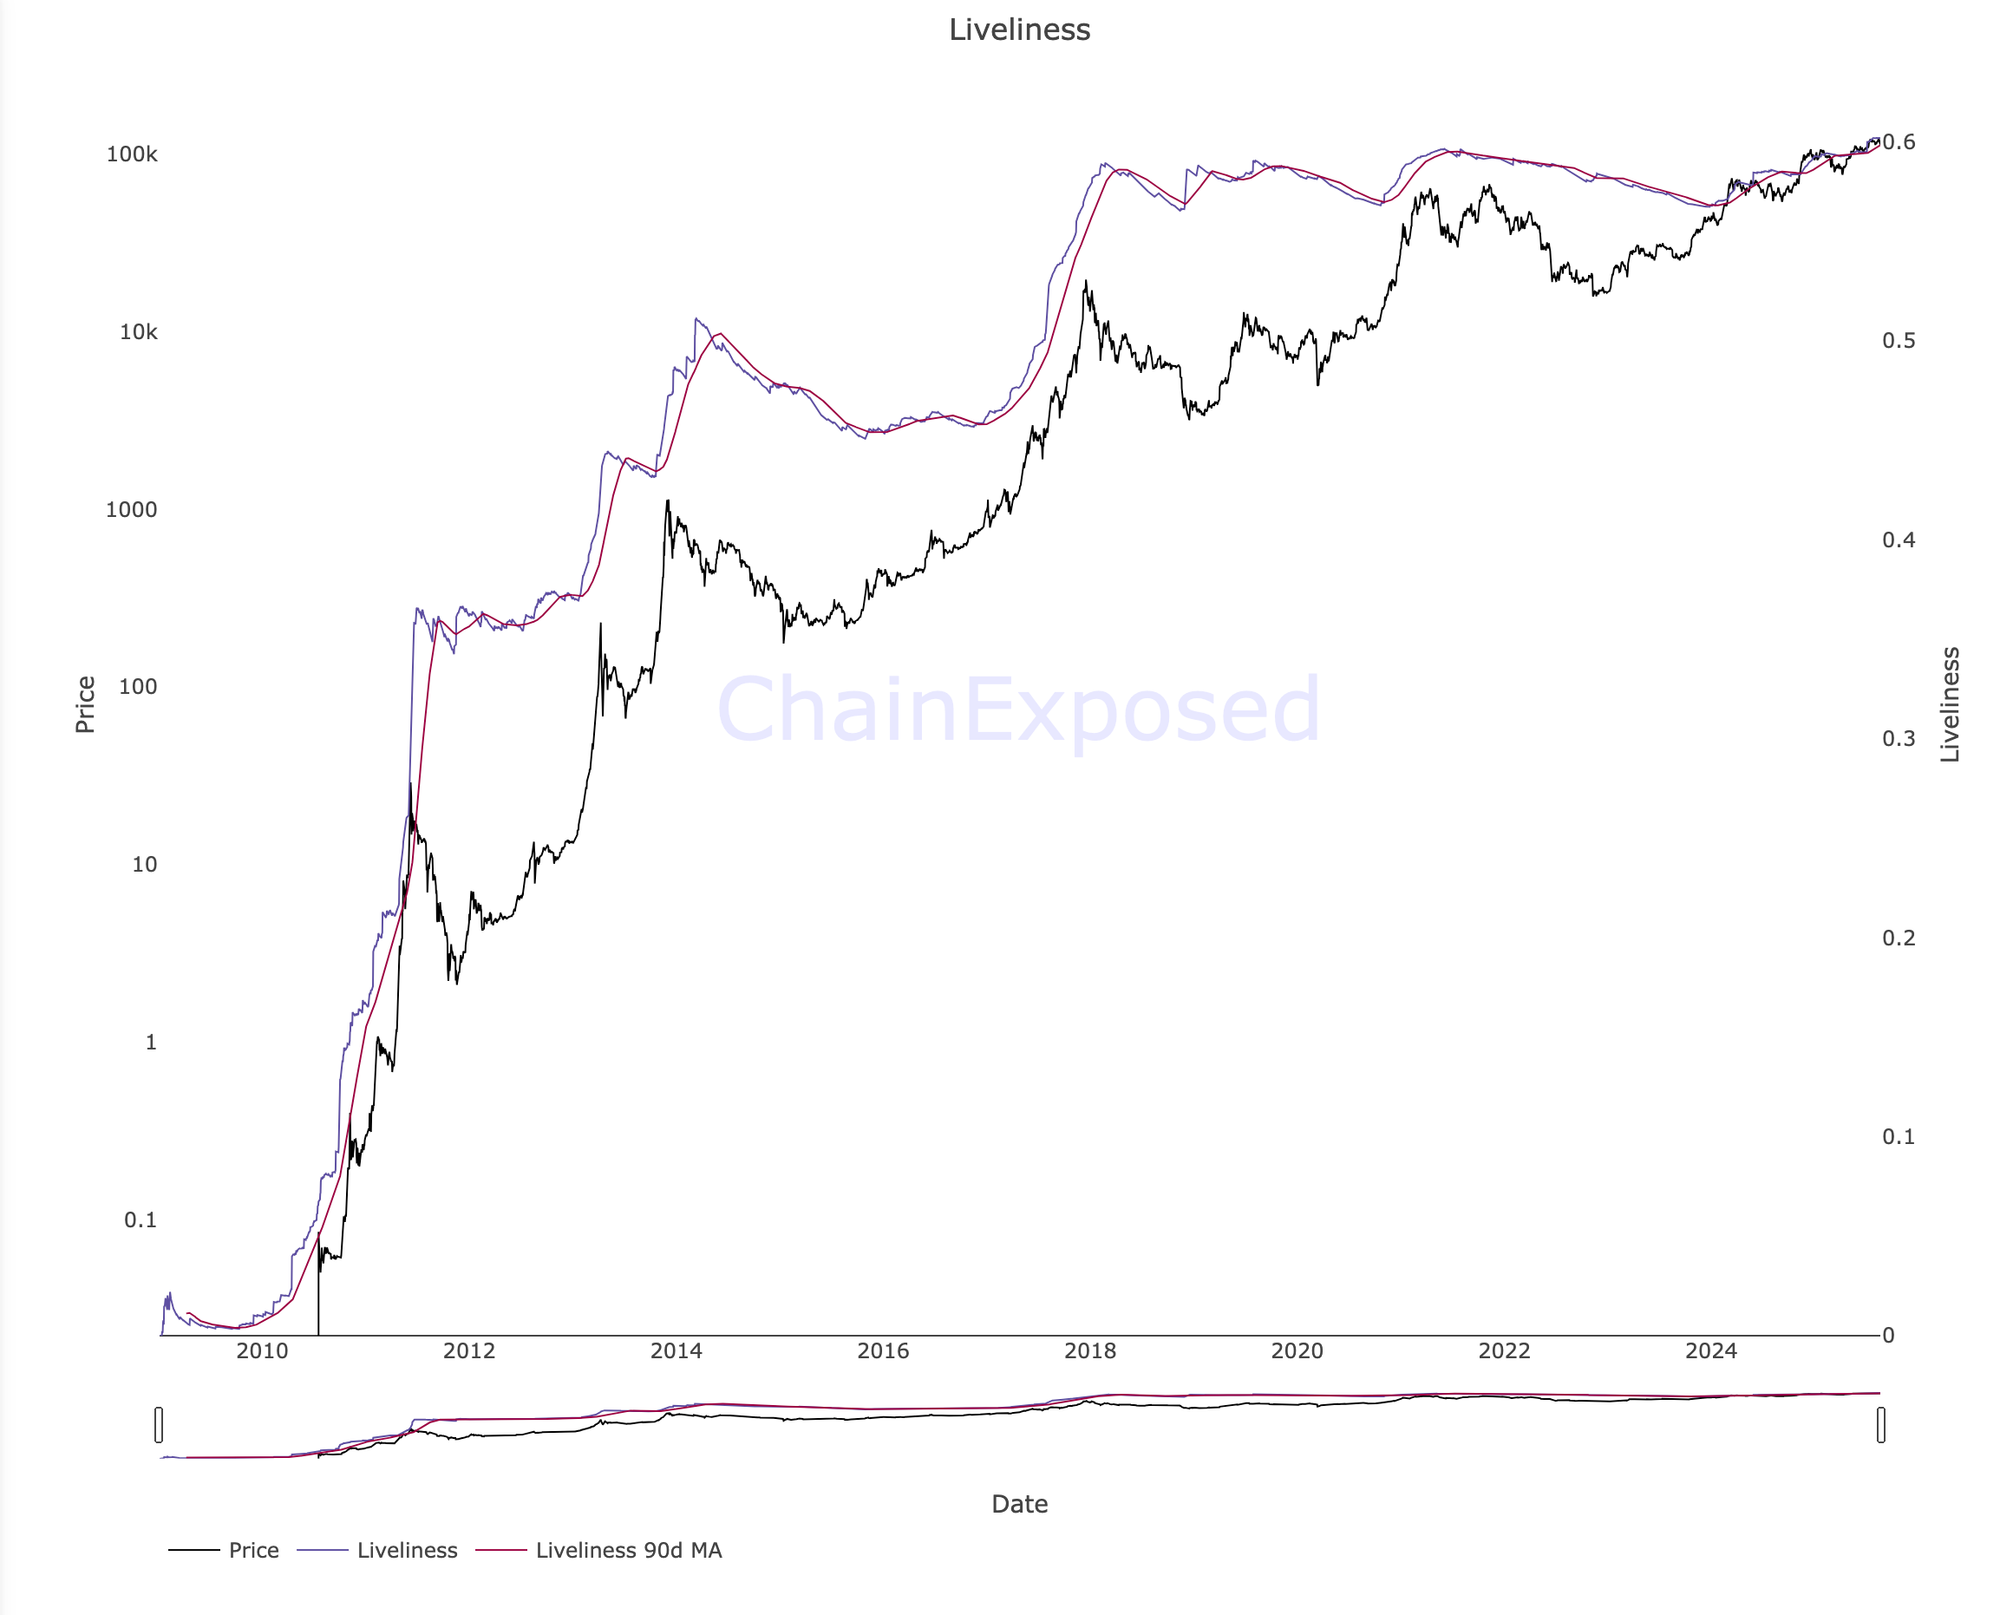
Bitcoin Liveliness measures whether older coins are being spent or left to age. When Liveliness trends higher, coin days are being destroyed more aggressively, which often means older supply is moving and spending pressure is rising. When Liveliness trends lower, coin days are accumulating, which usually means holders are saving and supply is ageing in place. Treat it as a behaviour dial, then confirm with age tools and profit and loss indicators before forming a view.
What Is Bitcoin Liveliness
Liveliness reflects the balance between coin days being destroyed and coin days being created over time. It is best treated as a behavioural dial that answers one question.
Are older coins being spent more, or are they ageing in place?
When older coins move, accumulated coin days are destroyed. When coins remain still, coin days build up. Liveliness turns that relationship into a long-term spending versus saving gauge.
How It Is Constructed Without The Maths Headache
- Every UTXO accumulates coin days while it remains unmoved.
- When that UTXO is spent, those accumulated coin days are destroyed.
- Liveliness compares destroyed coin days to created coin days across history.
- A higher ratio means more spending of older supply relative to saving.
You do not need the formula. Track direction and persistence.
What Rising Vs Falling Liveliness Really Means
Practical Guide Rails
Use these as guide rails, not gospel.
- Use a 30 day or 90 day moving average for regime.
- Slope up suggests spending bias.
- Slope down suggests saving bias.
- Pair rising Liveliness with exchange net inflows to spot sell pressure building.
- Pair falling Liveliness with exchange outflows for healthier trend conditions.
- A rally with falling Liveliness is often cleaner than a rally where Liveliness rises sharply.
Common Traps To Avoid
One day bursts can mislead. They can come from exchange housekeeping or entity re-tags. Wait for follow-through before treating them as a regime shift.
Rising does not always mean bearish. It can reflect benign rotation or miners funding operations. Confluence matters.
Age still matters. Pair with CDD or VDD Multiple to see which age bands are moving, not just that spending occurred.
Pair Liveliness With These Dials
- CDD or VDD Multiple to confirm whether older coins drove the move.
- SOPR or Realised PnL Ratio to see if profit-taking is being accepted while Liveliness rises.
- HODL Waves to see whether younger bands swell as older coins distribute.
- Exchange netflows and reserves to connect saving versus spending to venue liquidity.
A Weekly Workflow You Can Reuse
- Log the 90 day Liveliness slope as up, down, or flat.
- Check CDD or VDD to see whether the move is older supply led.
- Cross-check exchange netflows and reserves for venue pressure.
- If Liveliness is rising, exchange inflows persist, and Realised PnL Ratio sits above 1.0, treat risk as higher and avoid chasing weak breakouts.
- If Liveliness is falling and exchange outflows persist, look for dips that hold key levels before drawing a stronger conclusion.
- Review weekly. Persistence matters more than headlines.
Bitcoin Liveliness feeds the Holder Conviction score inside the Bitcoin Barometer. See where holder conviction sits in the current cycle.
See the Bitcoin Barometer →Mini FAQs
This content is for education only and does not constitute financial advice. Crypto assets are volatile and you can lose money. Always do your own research and consider your risk tolerance before making any investment decisions.


Discussion