


Start Here
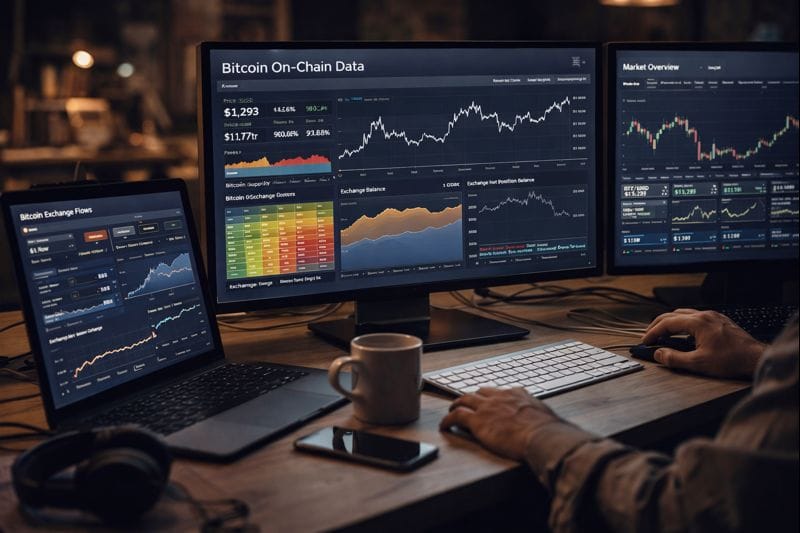
Bitcoin on chain indicators are metrics built from blockchain data. They help explain what is happening beneath price, including who is buying, who is selling, where cost basis sits, and how risk changes across a cycle.
This page is the public hub for The Markets Unplugged Bitcoin on chain guides. Use it to find the right metric quickly, then open the full explainer when you want the details.
If any terms feel unfamiliar, use the Bitcoin and Crypto Glossary for Beginners, then return to this hub to keep learning without getting lost.
Key Points
- Bitcoin on chain indicators are metrics built from blockchain activity, designed to explain behaviour beneath price.
- They are most useful for understanding cost basis, profit and loss pressure, holder behaviour, liquidity conditions, and demand sources.
- On chain works best as context and confirmation, not as a single signal that “predicts” price.
- Use this hub by starting with the question you are trying to answer, then picking the indicator family that matches it.
- Cross check at least two related guides before forming a view, because different metrics measure different parts of the system.
- Weekly reads are usually more useful than reacting to day to day noise.
- If any terms feel unfamiliar, use the glossary first, then return to this hub.
- This hub is updated as new guides go live, so it stays current as the library grows.
Members On Chain Analysis
- This hub collects the public Bitcoin on chain guides, the education layer.
- Members on chain analysis is the application layer, ongoing reads, updates, and weekly context that connects multiple metrics together.
- Public guides explain what each indicator is and how to read it.
- Members analysis combines several indicators into one weekly view, so signals are not interpreted in isolation.
- Members can access the Bitcoin on chain analysis feed here.
Quick Picker
- Start with the question you are trying to answer.
- Use the matching section below to find the right group of Bitcoin on chain guides.
- If the question is “Is Bitcoin overheated or undervalued?” go to Valuation And Cycle Regime Guides.
- If the question is “Are holders taking profit or capitulating?” go to Profit Loss And Spending Behaviour Guides.
- If the question is “Is supply tightening or releasing?” go to Holder Behaviour And Supply Dynamics Guides.
- If the question is “Is demand coming from exchanges, miners, or ETFs?” go to Flows Venues And External Demand Guides.
- If the question is “Who is buying, shrimps to whales?” go to Cohorts And Whales Guides.
- If the question is “Is this a bear market style environment?” go to Market Regime Guides.
Valuation And Cycle Regime Guides
- Use these when you are trying to judge whether Bitcoin is cheap or expensive, and whether the market is shifting regime.
- Puell Multiple Reading Miner Revenue For Bitcoin Tops And Bottoms
- Reserve Risk And HODL Bank Holder Confidence Versus Price
- MVRV Ratio Explained What It Is And How To Use It In Bitcoin Analysis
- MVRV Z Score For Bitcoin A Beginners Guide To Risk Bands
- NUPL Net Unrealised Profit Loss Cycle Phases And Practical Reads
- Realised Price Bands Market Long Term Holder And Short Term Holder Cost Basis Explained
- Realised Capitalisation Why Realised Cap Beats Market Cap For Signal
- URPD UTXO Realised Price Distribution Where Bitcoins Cost Basis Sits
- How To Read The Bitcoin AHR999 Indicator And Its Valuation Bands
- Mayer Multiple Bands 200 Day Guide For Entries And Risk
- Pi Cycle Top And 111 And 350 DMA Cross What It Really Signals And What It Does Not
- How To Read CBBI Composite Bitcoin Bullish Index Components Zones And Signals
Profit Loss And Spending Behaviour Guides
- Use these when you are trying to track profit taking, capitulation, and spending pressure.
- SOPR Spent Output Profit Ratio How To Read Bitcoin Profit And Loss Flows
- Realised Profit And Realised Loss What Capitulation And Euphoria Actually Look Like
- Realised PnL Ratio Using Profit Loss Balance As A Timing Filter
- Coin Days Destroyed Dormancy Flow And VDD Multiple What Spending Age Says
- How To Use Bitcoin ASOL And MSOL Spot Old Coin Moves With Confidence
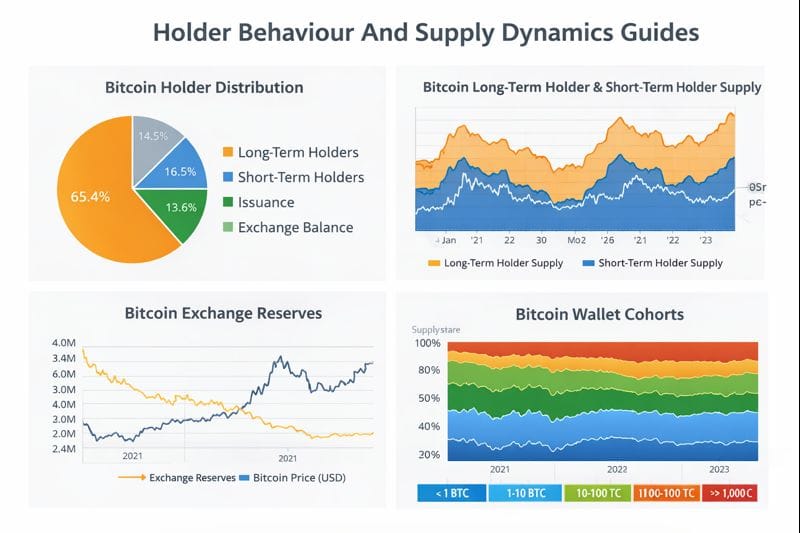
Holder Behaviour And Supply Dynamics Guides
- Use these when you are trying to understand accumulation and distribution, and how supply behaviour changes over time.
- HODL Waves And Realised HODL Waves RHODL Visualising Age Band Rotation
- RHODL Ratio Age Band Pressure And Why It Matters This Cycle
- What Is Bitcoin Liveliness And How Do You Use It
- How To Read Bitcoin HODLer Net Position Change Who Is Accumulating Who Is Distributing
- Bitcoin Supply Last Active 1 Year 2 Years 3 Years Reading Dormant Supply Pressure
- Which Bitcoin Cohort Carries The Risk Long Term Or Short Term Holders
Flows Venues And External Demand Guides
- Use these when you are trying to track liquidity, exchange behaviour, miner flows, and ETF driven demand.
- How To Read Bitcoin Exchange Reserves And Netflows Spot Liquidity And Stress
- How To Read Bitcoin Exchange Netflows Daily Vs Weekly Separate Noise From Signal
- How To Read Bitcoin Miner Balance And Miner To Exchange Flow Issuance Pressure Or Calm
- How To Read Bitcoin ETF Netflows Vs On Chain Flows Reconciling External Demand With Holder Data
Cohorts And Whales Guides
- Use these when you are trying to see which wallet sizes are accumulating or distributing.
- Which Bitcoin Cohorts Are Buying How To Read Address Distribution From Shrimps To Whales
Market Regime Guides
- Use these when you want on chain context for bear market conditions and recovery phases.
- How Bitcoin Bear Market On Chain Signals Show When Bottoms Are Close
Mini FAQs
What is the best Bitcoin on chain indicator for beginners?
Start with realised price bands, MVRV, and SOPR because they map cost basis, risk, and profit taking in a simple workflow.
Do Bitcoin on chain indicators predict price?
No. They explain behaviour and risk conditions. Price can still move first, and on chain often confirms later.
How often should Bitcoin on chain metrics be checked?
Weekly is usually enough for most people. Daily checks often add noise without improving judgement.
Why do multiple Bitcoin on chain indicators sometimes disagree?
They measure different parts of the system. Spending, holding, liquidity, and cost basis can point in different directions at the same time.
Are ETF flows more important than Bitcoin on chain flows now?
ETF flows capture external demand. On chain flows still matter because they show whether holders are distributing into that demand or holding through it.
If this helped you and you want to go deeper, Alpha Insider members can access the full Bitcoin on chain analysis library.
Alpha Insider members also get:
➡️ Kairos timing windows to plan entries before the crowd moves
➡️ A full DCA Targets page with levels mapped for this cycle
➡️ Exclusive member videos breaking down charts in plain English
➡️ A private Telegram community where conviction is shared daily
Built for signal, not distraction.
Legal And Risk Notice
This content is for education only and does not constitute financial advice. Crypto assets are volatile and you can lose money. Always do your own research and consider your risk tolerance.


Discussion